122 JQuery Chart_graph Plugins
Are you looking for JQuery Chart_graph Plugins If yes then you are on right place because here we have collected most popular 122 JQuery Chart_graph Plugins for you. you can choose any of following JQuery Chart_graph Plugins which suits best to your web based projects, These all are highly rated JQuery Chart_graph Plugins.
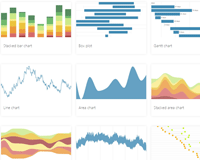
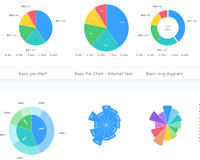 G2 is a visualization grammar, a data-driven visual language with a high level of usability and scalability. It provides a set of grammars, takes users beyond a limited set of charts to an almost unlimited world of graphical forms.....
Chart_Graph
Core Java Script
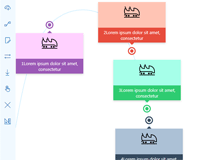
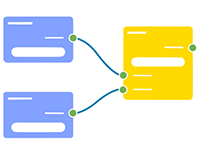 Rete is a modular framework for visual programming. Rete allows you to create node-based editor directly in the browser. You can define nodes and workers that allow users to create instructions for processing data in your edito.....
Chart_Graph
Core Java Script
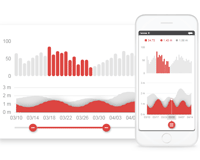
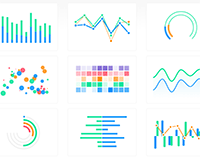 Apexcharts.js is a modern JavaScript charting library to build interactive charts and visualizations with simple API.Features:AnnotationsMixed ChartsHeatmapsSparklinesGaugesDynamic Data Updation .....
Chart_Graph
Core Java Script
HTML5
SVG Tutorial
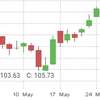
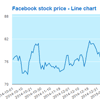
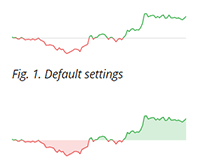 Dailychart.js is a tiny standalone SVG charting library to display daily graph of a stock market security. .....
Chart_Graph
Core Java Script
SVG Tutorial
 Picasso.js is a charting library streamlined for building visualizations for the Qlik Sense Analytics platform. .....
Chart_Graph
Core Java Script
 SVGFlowBox is a lightweight SVG based event highlighting on flow paths. .....
Chart_Graph
SVG Tutorial
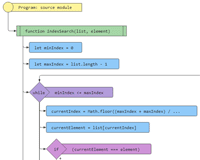 js2flowchart – a visualization library to convert any JavaScript code into beautiful SVG flowchart. Imagine a library which takes any JS code and generate SVG flowchart from it, works on client and server. Allows you easily.....
Chart_Graph
Core Java Script
SVG Tutorial
 ECharts is a free, powerful charting and visualization library offering an easy way of adding intuitive, interactive, and highly customizable charts to your commercial products. It is written in pure JavaScript and based on zrend.....
Chart_Graph
Core Java Script
 HTML5 CANVAS-based charting solution with excellent performance Works on all HTML5-supported browsers With a single development effort, the chart layout and style can be used on multiple devices.30 essential chart types, which is .....
Chart_Graph
Core Java Script
HTML5
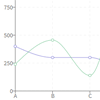
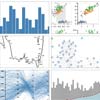
 IVIS is a chart editor for interactive visualisation, based on jQuery and HighCharts. Chart types include dot/scatter, 2D scatter, line, bar/column, pie, and heat map. It’s powerful when analysing large data sets. Dot / Sca.....
Chart_Graph
Plugins
 billboard.js is a re-usable easy interface JavaScript chart library, based on D3 v4+. .....
Chart_Graph
Core Java Script
 CircleChart is a small jQuery plugin is useful for creating simple pie charts. .....
Chart_Graph
Plugins
 By default all amCharts libraries accept data in JSON format. It needs to be there when the web page loads, defined in-line or loaded via custom code.This plugin introduces are native wrapper that enables automatic loading of data.....
Chart_Graph
Core Java Script
jSON
 WebGL based JavaScript library for creating high-resolution 3D globes and 2D maps. It supports different map providers, weather simulations, and a ton of other complex features. Their Demos page has a big collection of community p.....
Chart_Graph
Core Java Script
Maps
 Charts library built on top of React and D3. Graphs can be created via a simple XML-like syntax, with many of the important options set directly as attributes. The library also offers a rich examples catalog with more than 50 read.....
Chart_Graph
Core Java Script
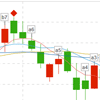
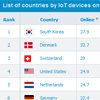
 IguanaCharts is HTML5 jQuery Stock Charts library.You can download our open source library and setup powerful stock chart just in minutes.Features:Zoom and load chart history with mouse wheelDraw on chart trend lines, fibonacci, c.....
Chart_Graph
Plugins
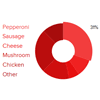
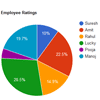 A pie chart (or a circle chart) is a circular statistical graphic, which is divided into slices to illustrate numerical proportion.It is generally used in business world when you have to display comparison or difference of some da.....
Chart_Graph
PHP
 Graphart is HTML5/JavaScript charting library based on the Canvas, which allows you to create rich charts that are completely responsive and work in all browsers. Nowadays, data visualization and analysis is now an key factor of b.....
Chart_Graph
Core Java Script
 Fcharts is a focus on the pure JS charting library of Stock Financial. .....
Chart_Graph
Core Java Script
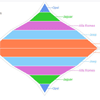
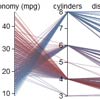 A d3-based parallel coordinates plot in canvas. .....
Chart_Graph
Core Java Script
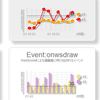
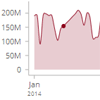 MetricsGraphics.js is a library built on top of D3 that is optimized for visualizing and laying out time-series data. It provides a simple way to produce common types of graphics in a principled, consistent and responsive way. The.....
Chart_Graph
Core Java Script
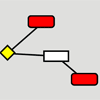
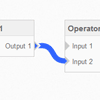 jQuery flowchart.js is an open source jquery ui plugin that allows you to draw and edit a flow chart.Draw boxes (called operators) and connections between them.Methods are provided so that the end-user can edit the flow chart by a.....
Chart_Graph
Plugins
 jQuery plugin for adding interactive charts and graphs to your website.Full functionality of FusionCharts can be accessed through it – charts, events, methods etc.You will have access to all the rich features of FusionCharts.....
Chart_Graph
Plugins
 FancyGrid is JavaScript grid library with charts integration and server communication.Massive number of features: Paging, Sorting, Ajax data, Files data, REST communication with server, Integration (data binding) with charts, Them.....
Ajax
Chart_Graph
Core Java Script
Tables
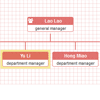 With the help of DOM, jQuery and CSS3 transition, we got a simple and direct organization chart plugin. .....
Chart_Graph
Plugins
 Create your own interactive line,bar,pie,radar,map,cone,chord e.t.c. chart easilyPower CustomizableGreatly ExamplesSave as PNG Images all chartsChange chart type easilyChange color easilyCustomizable Map ChartsInteractive Chart El.....
Chart_Graph
Plugins
Premium
 jQuery plugin to make Graphviz SVG output more interactive and easier to navigate. Makes it easy to have features like:Highlight nodes/edgesZoom in/outGraph navigation – select linked nodesFancy UI tooltips; bootstrap suppor.....
Chart_Graph
Plugins
Responsive
SVG Tutorial
 VivaGraphJS is the fastest graph drawing javascript library (proof). It is designed to be extensible and to support different rendering engines and layout algorithms. .....
Chart_Graph
Core Java Script
 Growraf (pronounced grow-rough) is a jquery plugin for flot charts, that produces smooth animations using requestAnimationFrame wherever possible. .....
Animation
Chart_Graph
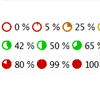 jQuery plug-in for dynamically rendering a pie or circle diagram comparable to a progress bar, depicting a progress, countdown, percent value or similar. .....
Chart_Graph
Plugins
SVG Tutorial
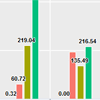
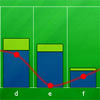
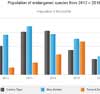
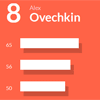 An interactive bar graph packed with animations and information. Built with CSS and jQuery. .....
Animation
Chart_Graph
CSS
Responsive
 A lightweight JavaScript library that generates circular graphs in SVG.The circular graphs with the numerical value in the center have been a great way to visualizing data lately. .....
Chart_Graph
Core Java Script
SVG Tutorial
 Pizza is a responsive pie, donut, bar, and line graph charting library based on the Snap SVG framework from Adobe. It focuses on easy integration via HTML markup and CSS instead of JavaScript objects, although you can pass JavaScr.....
Chart_Graph
Core Java Script
SVG Tutorial
 Fed up with the old tab designs that you have?
Have your website a totally tab-licious makeover with this distinctive and eye catching tab designs.8 Tab DesignsFlexible DesignsFully Responsive including its contentsIncludes Typo.....
Fed up with the old tab designs that you have?
Have your website a totally tab-licious makeover with this distinctive and eye catching tab designs.8 Tab DesignsFlexible DesignsFully Responsive including its contentsIncludes Typo.....
Chart_Graph
CSS
Premium
Responsive
Tables
Tabs
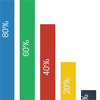 A CSS based chart system for building vertical and horizontal charts. .....
Chart_Graph
CSS
 WebCola is an open-source JavaScript library for arranging your HTML5 documents and diagrams using constraint-based optimization techniques. It works well with libraries like D3.js and svg.js .....
Chart_Graph
Core Java Script
HTML5
 OSGJS is a WebGL framework based on OpenSceneGraph concepts. It allows an individual to use an “OpenSceneGraph-like” toolbox to interact with WebGL via JavaScript, and provides facilities for exporting various assets to the os.....
Animation
Chart_Graph
Core Java Script
 Chartist.js is a simple responsive charting library built with SVG. There are hundreds of nice charting libraries already out there, but they are either:not responsiveuse the wrong technologies for illustration (canvas)are not fle.....
Chart_Graph
Core Java Script
Responsive
SVG Tutorial
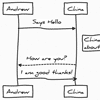 Draws simple SVG sequence diagrams from textual representation of the diagram. .....
Chart_Graph
Core Java Script
SVG Tutorial
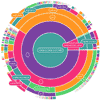 Cake Chart is a javascript library to create interactive multi-layer pie charts. .....
Chart_Graph
Core Java Script
 Vega is a visualization grammar, a declarative format for creating and saving interactive visualization designs. With Vega you can describe data visualizations in a JSON format, and generate interactive views using either HTML5 Ca.....
Chart_Graph
Core Java Script
HTML5
SVG Tutorial
 This is a Simple and Realtime JavaScript chart that does not depend on libraries such as jQuery or google APIs. .....
Chart_Graph
Core Java Script
 Simple SVG flow chart library based on jQuery and jQueryUI.This is a small JavaScript library with single purpose – draw some nodes and connect them with lines. You can use this library to create your own flow charts or crea.....
Chart_Graph
Drag_Drop
SVG Tutorial
 PivotTable.js is a Javascript Pivot Table library with drag’n’drop functionality built on top of jQuery/jQueryUI and originally written in CoffeeScript by Nicolas Kruchten at Datacratic.PivotTable.js’ basic funct.....
Chart_Graph
Plugins
Tables
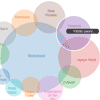 A javascript library for laying out area proportional venn and euler diagrams.This library depends on d3.js to display the venn diagrams. .....
Chart_Graph
Core Java Script
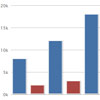
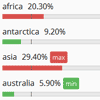 BarIndicator is a jQuery plugin that helps you visualize numeric data (percentage or absolute numbers) in to bars. .....
Chart_Graph
Plugins
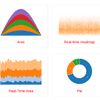 Epoch is a general purpose charting library for application developers and visualization designers. It focuses on two different aspects of visualization programming: basic charts for creating historical reports, and real-time char.....
Chart_Graph
Core Java Script
 Simple jquery flot plugin to show bar numbers in bar graph.This plugin is working well with zooming and panning (navigation plugin) too. .....
Chart_Graph
Plugins
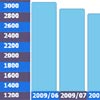
 Dynamic Stock Charts is a jQuery plugin, which allows embedding highly customizable dynamic stock charts of almost any publicly traded company into your website by using simple HTML snippets automatically generated by the included.....
Chart_Graph
Other API
Plugins
Premium
 Sophisticated and simplified Javascript 2D line charts.Highly customizable, extensible and flexible.Multiple graph ability.Automatic data scaling.Custom labelling.Retina scaling. .....
Chart_Graph
Core Java Script
 This is a very simple web service designed to get you from Point A to Point B as quickly as possible, where Point A is not having a chart and Point B is having a chart. .....
Chart_Graph
Plugins
 Evolutility provides a set of generic Backbone Views to browse, edit, filter, export and chart Backbone models and collections of different structures. With it you configure views with metadata instead of hand-coding templates, Ja.....
Chart_Graph
Core Java Script
Forms
jSON
Tables
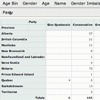
 A jQuery plugin that makes Google Charts out of HTML tables.Chartify currently supports bar charts (including stacked and grouped bar charts), pie charts, Venn charts and a simple diagram for displaying gender distributions. .....
Chart_Graph
Other API
Plugins
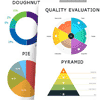 Grafikon is a JQuery Chart Plugin, that gives you the possibility to create your own unique chart with full customization. At present, there are six main modes: evaluation, pyramid, line, pie, doughnut and progress. Grafikon is ea.....
Chart_Graph
Plugins
Premium
 jQuery plugin to create simple donut, bar or line charts with dom nodes. style with css. .....
Chart_Graph
CSS
Plugins
 If you are working for analytics project, you need a rich chart system to display big data results. Google is providing us a powerful chart tools that you can implement charts very simple, this tutorial will explain you how to imp.....
Ajax
Chart_Graph
Other API
 jQuery Calx is an Excel calculation engine and formula parser built as jQuery plugin.Rewrite the internal formula parser and plugin structure.Ability to register new function and override default one.Ability to register variable.E.....
Chart_Graph
Forms
Plugins
 A jQuery plugin for transforming HTML tables into charts using Google Charts. .....
Chart_Graph
Plugins
 TauCharts is a Javascript charting library with a focus on design and flexibility. It’s open source and based on D3.js. .....
Chart_Graph
Core Java Script
 ZingChart offers jQuery charts by providing this wrapper for the ZingChart charting library that allows for jQuery-style use of the 88 different API methods and 81 different API events that ZingChart has to offer. It’s desig.....
Chart_Graph
Core Java Script
 jQuery.linking is a jQuery plugin designed for linking graphically webpage elements in a simple way. .....
Chart_Graph
Drag_Drop
Plugins
 Sheetsee.js is a client-side library for connecting Google Spreadsheets to a website and visualizing the information in tables, maps and charts.Google Spreadsheets can be used as simple and collaborative databases, they make getti.....
Chart_Graph
Core Java Script
Other API
Tables
 C3 is a D3-based reusable chart library that enables deeper integration of charts into web applications.C3 makes it easy to generate D3-based charts by wrapping the code required to construct the entire chart. .....
Chart_Graph
Core Java Script
 CanvasJS Charting Plugin for jQuery lets you add beautiful & interactive charts to your web page with a few lines of code. Charts have high performance and can run across devices include Desktops, Tablets, iPhone, Android, etc.....
Chart_Graph
Plugins
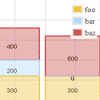
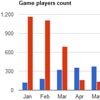
 A very simple jQuery plugin to render bar chart from existing HTML tables.Easy to use (no extra javascript code to define data).Animation (at display time and hovering on legend item)Popup for value of each barSupport group by tab.....
Chart_Graph
Plugins
Tables
 Crossfilter is a JavaScript library for exploring large multivariate datasets in the browser. Crossfilter supports extremely fast (<30ms) interaction with coordinated views, even with datasets containing a million or more recor.....
Chart_Graph
Core Java Script
 Graphene is a realtime dashboard & graphing toolkit based on D3 and Backbone.Combining D3’s immense capabilities of managing live data, and Backbone’s ease of development, Graphene provides a solution capable of di.....
Chart_Graph
Core Java Script
 jsMorph is a morphing – motion – tweening framework that knows what you need to do… get going! It’s a nice ensemble of best timing, fast, smart and resource saving algorithms and convenience.jsMorph is a c.....
Animation
Chart_Graph
Core Java Script
Image Effects
Menus
Slider
 Flot is a pure JavaScript plotting library for jQuery, with a focus on simple usage, attractive looks and interactive features. .....
Chart_Graph
Plugins
 A very simple jQuery plugin to render bar chart from existing HTML tables.Easy to use (no extra javascript code to define data).Animation (at display time and hovering on legend item)Popup for value of each barSupport group by tab.....
Chart_Graph
Plugins
 Bobbograph is a highly configurable Canvas-based graphing library for jQuery. It provides you with the power to render great looking graphs across all modern browsers. Bobbograph is also built to utilize Excanvas for older version.....
Chart_Graph
Plugins
 OSGJS is a WebGL framework based on OpenSceneGraph concepts. It allows an individual to use an “OpenSceneGraph-like” toolbox to interact with WebGL via JavaScript, and provides facilities for exporting various assets to the os.....
Chart_Graph
Core Java Script
 This custom JS charting library created by PSDDude from 0 implements custom HTML tags which allow creating charts and graphs for infographics.It is a light-weight, pure JavaScript charting library (NO jQuery or other libraries req.....
Chart_Graph
Core Java Script
HTML5
Premium
 Chart.js easy, object oriented JavaScript charting libaray with html5 canvas for designers and developers. It currently supports 6 chart types (line, bar, radar, pie, column and polar area) and all this comes in a standalone, <.....
Chart_Graph
Core Java Script
HTML5
 xCharts is a JavaScript library for building beautiful and custom data-driven chart visualizations for the web using D3.js. Using HTML, CSS, and SVG, xCharts are designed to be dynamic, fluid, and open to integrations and customiz.....
Chart_Graph
Core Java Script
SVG Tutorial
 Flot Animator is a free jQuery plugin that will add smooth or gradual animations to Flot charts.It will allow you to highlight and draw attention to some charts and/or series by easily adding animation to your existing charts.This.....
Animation
Chart_Graph
Plugins
 JavaScript toolkit for creating interactive real-time graphs.Rickshaw provides the elements you need to create interactive graphs: renderers, legends, hovers, range selectors, etc. You put the pieces together.It’s all based .....
Chart_Graph
Core Java Script
SVG Tutorial
 A very easy to use, cross platform, jQuery based UI toolkit, that’s still small in size, has the features you need, and doesn’t get in your way of doing things! .....
Ajax
Animation
Chart_Graph
Menus
Plugins
Popup Window
Slider
Zoom
 Flot is a pure JavaScript plotting library for jQuery, with a focus on simple usage, attractive looks and interactive features.Just include the Javascript file after you’ve included jQuery.Generally, all browsers that suppor.....
Chart_Graph
HTML5
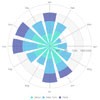
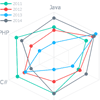
 jquery.spidergraph is a simple module that creates nice looking, interactive spidergraphs in HTML5, using the canvas element.Features:illustrating scaled quantitative data for several subjective attributesoverlaying multiple data .....
Chart_Graph
HTML5
Plugins
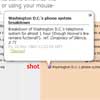
 CHAP Links Library is a web based visualization library for displaying graphs, networks, and timelines.The library is specially designed to be easy to use, to handle large amounts of data, and to enable manipulation of the data. T.....
Chart_Graph
Core Java Script
Tables
 Charts are a great visual aid when presenting data. You can’t build a professional admin panel without them. They are also tricky to set up. However, there is a new library that makes things easier – xCharts. Today, we are goi.....
Ajax
Bootstrap
Chart_Graph
PHP
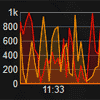
 Smoothie Charts is a really small charting library designed for live streaming data. I built it to reduce the headaches I was getting from watching charts jerkily updating every second. What you’re looking at now is pretty m.....
Chart_Graph
Core Java Script
 jStat is a statistical library written in JavaScript that allows you to perform advanced statistical operations without the need of a dedicated statistical language (i.e. MATLAB or R). The majority of jStat functions can be used i.....
Chart_Graph
HTML5
 JpGraph is an Object-Oriented Graph creating library for PHP >= 5.1 The library is completely written in PHP and ready to be used in any PHP scripts (both CGI/APXS/CLI versions of PHP are supported). .....
Chart_Graph
Core Java Script
PHP
 jsDraw2DX is a standalone JavaScript library for creating any type of interactive graphics with SVG (and VML for old IE browsers). Besides the ability to generate all basic shapes like line, rectangle, polygon, circle, ellipse, ar.....
Chart_Graph
Core Java Script
HTML5
SVG Tutorial
 Protovis composes custom views of data with simple marks such as bars and dots. Unlike low-level graphics libraries that quickly become tedious for visualization, Protovis defines marks through dynamic properties that encode data,.....
Animation
Chart_Graph
Core Java Script
 jqChart takes advantages of HTML5 Canvas to deliver high performance client-side charts and graphs across browsers (IE 6+, Firefox, Chrome, Opera, Safari) and devices, including iOS and Android mobile devices. Full Touch support.F.....
Chart_Graph
HTML5
Plugins
 JS Charts is a JavaScript based chart generator that requires little or no coding. With JS Charts drawing charts is a simple and easy task, since you only have to use client-side scripting (i.e. performed by your web browser). No .....
Chart_Graph
Core Java Script
jSON
XML
 Bonsai is a JavaScript graphics library.Bonsai’s main features include:Architecturally separated runner and rendereriFrame, Worker and Node running contextsPathsAssets (Videos, Images, Fonts, SubMovies)Keyframe and time base.....
Animation
Chart_Graph
Core Java Script
 jsPlumb provides a means for a developer to visually connect elements on their web pages. It uses SVG or Canvas in modern browsers, and VML on IE 8 and jQuery.jsPlumb adds an element to the DOM for each Endpoint, Connector and Ove.....
Animation
Chart_Graph
Drag_Drop
Plugins
SVG Tutorial
Web
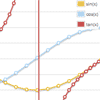
 In this tutorial we will code an Interactive Graph using jQuery and CSS3. We will use the jQuery’s popular plotting plugin “Flot”. Flot is a pure JavaScript plotting library for jQuery. It produces graphical plots of arbitra.....
Chart_Graph
CSS
Plugins
 This project is an attempt to build re-usable charts and chart components for d3.js without taking away the power that d3.js gives you. This is a very young collection of components, with the goal of keeping these components very .....
Chart_Graph
Core Java Script
 Easy pie chart is a jQuery plugin that uses the canvas element to render simple pie charts for single values. These chars are highly customizable and very easy to implement.To use the easy pie chart plugin you need to load the cur.....
Chart_Graph
Plugins
 jQuery based javascript plugin that converts a standard HTML table to an Google visualizations chart and displays it on the page.Currently converts a table to one of these google charts:barcolumnarealinePie .....
Chart_Graph
Plugins
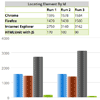
 Numeric data quickly becomes difficult for us humans to understand. Once the number of rows or columns in a table passes two or three, the meaning quickly becomes harder to grasp. The easiest way to give meaning to numeric data is.....
Chart_Graph
jQuery Mobile
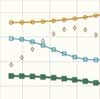
 dygraphs is an open source JavaScript library that produces produces interactive, zoomable charts of time series. It is designed to display dense data sets and enable users to explore and interpret them.FeaturesPlots time series w.....
Chart_Graph
Core Java Script
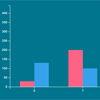
 jQuery plugin for creating bar graphs from your data. jqBarGraph is compatible and fully tested with Safari 2+, Internet Explorer 6+, Firefox 2+, Google Chrome 3+, Opera 9+.There is two type of data array for jqBarGraph. First is .....
Chart_Graph
Plugins
 Cubism.js is a plugin for D3.js, a JavaScript visualization library for HTML and SVG, to display time series in real-time. It has built-in support for Graphite and Cube, and can be readily extended to fetch data from other sources.....
Chart_Graph
Core Java Script
SVG Tutorial
 RGraph is a HTML5 Javascript charts library that supports over 20 different types of charts. Using the new HTML5 canvas tag, RGraph creates these Javascript charts in the web browser, meaning quicker pages and less web server load.....
Chart_Graph
Core Java Script
HTML5
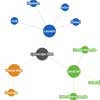 Cytoscape Web is an open-source graph visualisation library for the web. It is written in JavaScript as a jQuery library.Cytoscape Web allows you to easily display graphs in your websites. Because Cytoscape Web allows the user to .....
Chart_Graph
Plugins
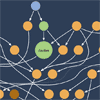
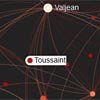 sigma.js is an open-source lightweight JavaScript library to draw graphs, using the HTML canvas element. sigma.js is mostly inspired by Gephi and the maps of Antonin Rohmer from Linkfluence (one nice example here) – thanks to hi.....
Chart_Graph
Core Java Script
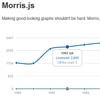 Morris.js is a small JavaScript library for visualizing time-series data beautifully.It is built on top of jQuery + Raphaël and displays the data over an interactive line graph.The library has a very straightforward API with a si.....
Chart_Graph
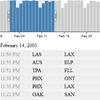
 Timeline is a JavaScript widget for creating interactive timelines. You can scroll through items featured in chronological order by using your mousewheel or by holding down your mouse button on the timeline and dragging left or ri.....
Chart_Graph
Core Java Script
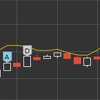
 Timeplot is a DHTML-based AJAXy widget for plotting time series and overlay time-based events over them (with the same data formats that Timeline supports). .....
Chart_Graph
Core Java Script
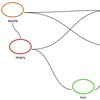 Dracula is a set of tools to display and layout interactive graphs, along with various related algorithms.No Flash, no Java, no plug-ins. Just plain JavaScript and SVG. The code is released under the MIT license, so commercial use.....
Chart_Graph
Core Java Script
SVG Tutorial
 gRaphael is an Open Source Javascript Charting Library based on Raphael Javascript Library. It helps you to create stunning static and interactive charts with ease.gRaphaël is cross browser compatible and currently supports Firef.....
Chart_Graph
Core Java Script
 gvChart is a jQuery plugin, that uses Google Charts API to create interactive visualization by using data from the HTML table tag.Its very easy to create charts with gvChart jQuery plugin:1. Create an HTML table
2. Download and .....
gvChart is a jQuery plugin, that uses Google Charts API to create interactive visualization by using data from the HTML table tag.Its very easy to create charts with gvChart jQuery plugin:1. Create an HTML table
2. Download and .....
Chart_Graph
Plugins
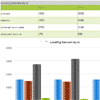
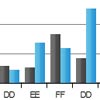
 DDChart is a JSON data driven bar chart plugin that creates a classy bar chart with flash like animation effects.Its a small yet useful bar chart jQuery plugin that is packed with nice features including:Zoom-in / zoom-out effect .....
Chart_Graph
jSON
 Here at PMSIpilot we wanted to use Highcharts graph library but with a way to convert automatically our HTML tables containing data into graphs.So we decided to code a jQuery plugin to make this conversion peacefully. .....
Chart_Graph
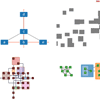
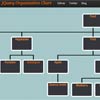 jQuery OrgChart is a jQuery plugin that allows you to render structures with nested elements in a easy-to-read tree structure. To build the tree all you need is to make a single line call to the plugin and supply the HTML element .....
Chart_Graph
CSS
Drag_Drop
Plugins
 jqPlot is a plotting and charting plugin for the jQuery Javascript framework. jqPlot produces beautiful line, bar and pie charts with many features. .....
Ajax
Chart_Graph
jSON
Plugins
 This jQuery plugin generates sparklines (small inline charts) directly in the browser using data supplied either inline in the HTML, or via javascript.The plugin is compatible with most modern browsers and has been tested with Fir.....
Chart_Graph
Plugins
 Elycharts is a pure JavaScript charting library, easy to use and completely customizable. It helps you create good looking interactive charts on you web pages or web applications, with a lot of useful features: legend and label su.....
Chart_Graph
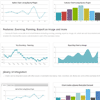
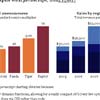
 Graphs of financial projections, quarterly sales figures and market saturation are a middle-manager’s dream.How can we as Web designers get in on all of this hot graph action? There are actually quite a few ways to display graph.....
Animation
Chart_Graph
CSS
HTML5
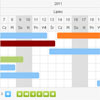 jQuery Gantt Chart is a simple chart that implements gantt functionality as a jQuery component.It’s able to:Read json dataPaging resultsDisplay different colours for each taskDisplay short description as hintsMark holidays .....
Ajax
Chart_Graph
jSON
Plugins
 Peity (sounds like deity) is a simple jQuery plugin that converts an element’s content into a simple <canvas> mini pie, line or bar chart. .....
Chart_Graph
Plugins
 TufteGraph is a JS library by which you can easily create graphs. All the configuration is by dynamic functions, allowing for a really compact API (very few options). Also, Non-core layout is done via CSS rather than code. You .....
Chart_Graph
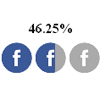
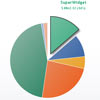 In this tutorial I’m going to show you how to build a lovely, interactive pie chart using the latest HTML5 technologies. Not that long ago, this kind of thing was only practical to do with Flash. Now, thanks to advances s.....
Animation
Chart_Graph
CSS
HTML5
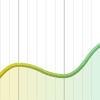
 Here is the Javascript using jQuery that fetch and format the data to be processed by Flot. .....
Chart_Graph
jSON
Plugins
jQuery Plugins
- 3D Slider
- AutoComplete
- Barcode
- Blur Effect
- Calculator
- Captcha
- Checkbox
- Color Picker
- Confirm Dialog
- Context Menu
- Cookies
- Countdown Timer
- Coverflow
- Currency Format
- DateTime Picker
- Dialog
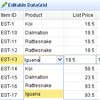
- Editable
- Event Calendar
- File Upload
- Filter
- Fixed Header
- Flipbook
- Form Submit
- Form Validation
- Form Wizard
- Fullscreen
- Geolocation
- Grid
- History
- Html5 Audio Player
- HTML5 canvas
- Html5 Local Storage
- Html5 Video Player
- Image Crop
- Image Hover Effect
- Lazy Load
- Login
- Mask
- Mega Menu
- MultiSelect
- News Ticker
- Notification
- Parallax
- Placeholder
- Portfolio
- Preloader
- Progress Bar
- Range Slider
- Rating
- Rotate Image
- Scrollbar
- Scrolling Effects
- SelectBox
- Shopping Cart
- Side Menu
- Social Share
- Sorting
- Timeline
- Tooltip
- Treeview
- Video Background
- Weather
- Website Tour
- Wysiwyg Editor
- YouTube
AngularJs Plugins
- Accordion
- Animation
- Application
- Autocomplete
- Bootstrap
- Calendar
- Carousel
- Chart_Graph
- Date_Time
- Drag_Drop
- Forms
- Gallery
- Maps
- Menu_Navigation
- Modal_Popup
- Plugins
- Premium
- Slider
- Table
- Tabs
- Text Effects
- Tutorials
- Video_Audio
- Zoom