Graphene
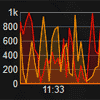
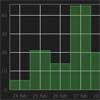
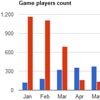
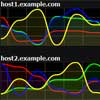
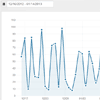
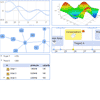
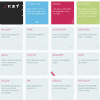
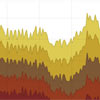
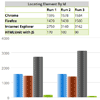
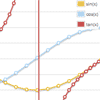
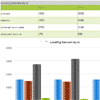
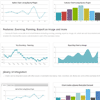
Graphene is a realtime dashboard & graphing toolkit based on D3 and Backbone.
It was made to offer a very aesthetic realtime dashboard that lives on top of Graphite (but could be tailored to any back end, eventually).
Combining D3's immense capabilities of managing live data, and Backbone's ease of development, Graphene provides a solution capable of displaying thousands upon thousands of datapoints in your dashboard, as well as presenting a very hackable project to build on and customize.
Getting Started
Currently, Graphene loves Graphite's data model (through its API).
To start,
$ git clone git://github.com/jondot/graphene.git $ cd graphene Running the Example
Use the /example dashboard to build on.
You should serve that folder off some kind of a helper webserver. For Ruby:
$ gem install serve $ serve . And open up your browser at http://localhost:4000/example/dashboard.html. You should see the dashboard alive, rigged with a demo data provider.
Setting up a Dev Env
This is a no brainer. You gotta have Ruby though; back to your root Graphene folder,
$ bundle install $ bundle exec guard start This gives you an autogenerated build when you modify stuff in app/css and app/js. Take note that dashboard.html points to the build folder where your assets are automatically built to.
Building a Dashboard
You are probably wondering how do you disconnect the demo data provider and plug the Graphite data source. Don't worry - more about it after this.
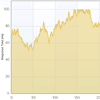
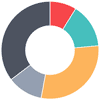
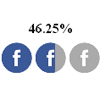
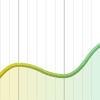
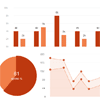
As of now, you can place 3 types of data-enabled widgets on your dashboard: TimeSeries, GaugeLabel, and a GaugeGadget
You can have as many of these as you want, and you can also hook up several widgets to the same data source.
To build a new dashboard, you can/should use the builder:
var g = new Graphene; g.demo(); // hook up demo provider, override all urls. g.build(description);Where description will be the hardest thing you'll have to do here. It is a hash structure, note that urls (since we use demo provider) do nothing. Here:
description = { "Total Notifications": { source: "http://localhost:4567/", GaugeLabel: { parent: "#hero-one", title: "Notifications Served", type: "max" } }, "Poll Time": { source: "http://localhost:4567/", GaugeGadget: { parent: "#hero-one", title: "P1" } }, "<just an informative label>": { source: "<graphite graph url, add &format=json to querystring>", "<widget type>": { parent: "<which will be placed in this element>", title: "<title>" // ... many other view opts ... } } }That's it basically. Advise the example for how your page should be structured.
Using Real Data
Lets see how to hook up a Graphite data source. You should first have an idea of how your dashboard looks like in "standard" graphite dashboard.
This means you can go ahead and build (or use) your dash with the "standard" dashboard tool that Graphite provides.
Cross-Domain
In any case, if you don't have your dashboard on the Graphite domain, you might have a cross-domain issue. In this case please set up your Chrome browser with google-chrome --disable-web-security.
Graphite Data API
Then, given that you saved your Graphite dashboard named resources, fetch this URL:
http://<graphite>/dashboard/load/resources You should see a JSON structure which contain these:
/render?from=-2hours&until=now&width=400&height=250&target=some.metric&title=my_metric Use that query. Append &format=json to it and you've got a Graphene-ready URL!
http://<graphite>/render?from=-2hours&until=now&width=400&height=250&target=some.metric&title=my_metric&format=json Autodiscovery
If all you really want is to migrate your Graphite "old" dash, a good starting point would be with discover(), which will take all of your timeseries and convert to a dashboard running Graphene TimeSeries:
var g = new Graphene; g.discover('http://my.graphite.host.com', 'dev-pollers', function(i, url){ return "#dashboard"; }, function(description){ g.build(description); console.log(description); });You should specify graphite host, dashboard name, a parent specifier which is responsible to spit out the next graph parent, and a result callback.
You can also use the description result as a starting point for building a more elaborate dashboard.
Check out an example at /examples/dashboard-autodiscover.html
I Want More!
Since Graphene is really a Backbone application (View, and Model, no Controller here), you should be aware that your data is fetched to a Model, munged on, and 'broadcasted' to interested parties (such as widgets).
This means you can take a look at the Model, and be able to configure it to your own needs. One example is specifying a refresh_interval.
It wouldn't make sense to poll on your Graphite backend frequently, if the data is updated slowly; turn refresh_interval up a notch.
Extra View options
You can drop any of the below options in the builder's dashboard description.
GaugeLabel
unit- unit to display, example "km", or "req/s"title- the gauge titletype- how should data get aggregated?maxpicks the largest value in the set of datapoints,minpicks the smallest value in the set of datapoints,currentpicks the newest value in the set of datapoints,- null or no setting picks the first value in the set.
value_format- you can specify a value formatter (see d3)
GaugeGadget
title- again, gauge titletype- same as GaugeLabelvalue_format- value formatfrom- start value of the gaugeto- end value of the gauge
TimeSeries
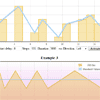
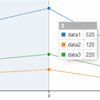
line_height- visuals, default 16animate_ms- new data animation innum_labels- max labels to display at the bottomsort_labels- order labels will be sorteddisplay_verticals- display vertical ticks (eww!)width- box widthheight- box heightpadding- the kind of padding you needtitle- box titlelabel_formatter- and a formatter, as before.ymax- the max value for the Y axis. If not specified and the URL has a yMax parameter, the value will be taken from the URL. Otherwise, this option will have precedence.ymin- the min value for the Y axis.
Visuals
Good news, other than problems with managing TONS of data points, I avoided using common graphing libraries because it's kinda hard to fit to how they see the world in terms of styling.
Here you'll be able to just style with CSS. Most graph elements are SVG, and you already have a good example of a high-contrast styling that I use.
Futher SVG is vector graphics. Try stretching up your dashboard, and you'll find the quality of render isn't affected.
Applying just common CSS rules should give you everything that you need.
Colors
A good thing to think about is colors in your graph. In a time series, you'd want each graph to appear distinct from the other, but still keep a general notion of style (relate to the previous one).
To do that, I've generated colors based on HSL, taking the next color on the wheel serially, and keeping a good distance for a good contrast.
For more detail, see /tools
Roadmap
These significant features will happen in the following weeks:
- Visual hints. Lower/upper threshold options for TimeSeries. Once a value passes above/below these, the Graph will give a visual cue (flashing, heartbeat)
- RSS widget. Include a stream of events using an RSS feed; provide regex rules which cause RSS entries to be included, or be classified as various levels of alerts. The goal is to be able to incorporate source control history (GitHub events), and alert feeds from other systems.
Thanks!
I'd like to thank (chronological order):
- Mike Bostock - for D3 itself, its awesome!. I found myself experimenting hours upon hours with it, but not caring about the time flying by at all.
- Tomer Doron (tomerd) - for the awesome D3 gauge gadget example which I've customized and included here.
- Chris Mytton (hecticjeff) - contributions
- Michael Garski (mgarski) - contributions
- dcartoon - JSONP cross domain support
- Sean Kilgore (logikal) - contributions
- arctanb - contributions
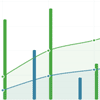
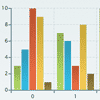
- Dennis van der Vliet (dennisvdvliet) - bar graphs and other contributions
- cognusion - contributions
- David Fisher (tibbon) - README fixes
- Jean-Louis Giordano (Jell) - contributions
- Michael Lavrisha (vrish88)- "current" gauge type
- EButlerIV - contributions
- David CHAU (davidchau) - contributions
- Phil Cohen (phlipper) - contributions
Contributing
Fork, implement, add tests, pull request, get my everlasting thanks and a respectable place here :).
Copyright
Copyright (c) 2012 Dotan Nahum @jondot. See MIT-LICENSE for further details.
