Bobbograph v3.0.0
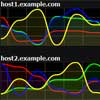
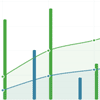
Bobbograph is a graphing tool for rendering Canvas-based line-graphs. This primary focus of this project is to allow as much customization as possible, leaving it up to the developer to decide what the graph will look like.
Options
Here is a basic overview of the available options:
| Property | Type | Description |
|---|---|---|
| width | Number | This number will set the width of the generated graph. |
| height | Number | This number will set the height of the generated graph. |
| data | Data Object | Allows some mild modification of the data. |
| padding | Padding Object | Allows customization of padding options. |
| line | Line Object | Allows customization of the line style. |
| frame | Frame Object | Allows customization of the framing. |
| animation | Animation Object | This allows an intro animation to be customized. |
| xAxis | Axis Object | Allows you to customize the x-axis. |
| yAxis | Axis Object | Allows you to customize the y-axis. |
| bevel | Bevel Object | Allows you to customize bevel effects on your line. |
| shadow | Shadow Object | Allows you to add a drop-shadow to your line. |
Data
| Property | Type | Description |
|---|---|---|
| vertex | Boolean | This will eliminate unnecessary points in the graph, resulting in a smoother graph. By default, this is only enabled with line smoothing is enabled. |
| maxPoints | Number | This is the maximum number of points you want to display. This can improve performance, and may be necessary with larger data sets. |
| normalize | Number | You can specify how many standard deviations you want to allow. Points that are too extreme will be removed. |
Padding
| Property | Type | Description |
|---|---|---|
| size | Number | This size will be applied to all 4 sides, unless overridden. |
| x | Number | This will specify left and right padding. |
| left | Number | This will set the left padding. |
| right | Number | This will set the right padding. |
| y | Number | This will set the top and bottom padding, unless overridden. |
| top | Number | This will set the top padding. |
| bottom | Number | This will set the bottom padding. |
Line
| Property | Type | Description |
|---|---|---|
| fill | Array/String | This specifies the line fill. It can be an array of colors or a single string. |
| width | Number | This sets the thickness of the line. |
| smooth | Boolean | When enabled, the graph will be smoothed for a better visual presentation. |
Fill
| Property | Type | Description |
|---|---|---|
| color | String | A color to fill the area beneath the curve. |
| gradient | Array | An array of colors to be used as a gradient fill. |
| vertical | Boolean | When using a gradient, this will indicate a vertical gradient. |
Frame
| Property | Type | Description |
|---|---|---|
| xmin | Number | The minimum x-value used to frame the graph. |
| xmax | Number | The maximum x-value used to frame the graph. |
| ymin | Number | The minimum y-value used to frame the graph. |
| ymax | Number | The maximum y-value used to frame the graph. |
Animation
| Property | Type | Description |
|---|---|---|
| duration | Number | The duration (in milliseconds) of the animation. |
| callback | Function | A method to be called when the animation has finished. |
Axis
| Property | Type | Description |
|---|---|---|
| increment | Number | The distance between axis lines. |
Bevel
| Property | Type | Description |
|---|---|---|
| shine | Number | The intensity of the shine effect. (0-1) |
| shadow | Number | The intensity of the shadow effect. (0-1) |
| smooth | Boolean | Whether or not you want the bevel effect to be softened. (causes rendering to be a heavier process) |
| opacity | Number | The overall opacity of the bevel effect. (0-1) |
Shadow
| Property | Type | Description |
|---|---|---|
| x | Number | The x-offset value for the shadow. |
| y | Number | The y-offset value for the shadow. |
| color | String | The color of the shadow. |