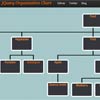
About Chartinator
Chartinator - Google Charts made easier and accessible.
- Description: A jQuery plugin for transforming HTML tables, Google Sheets and js arrays into charts using Google Charts
- Repository: https://github.com/jbowyers/chartinator
- Demo: http://chartinator.com
- Bower: chartinator
- Requires: jQuery, Google Charts
- Author: jbowyers
- Copyright: 2015 jbowyers
- License: GPLv3
- Version: 0.3.10
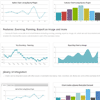
Demo
Visit http://chartinator.com to view a demo
What is this repository for?
Transforming HTML tables, Google Sheets and js arrays into charts using Google Chart ( https://developers.google.com/chart/ ).
What are the current features?
Chartinator currently supports the following:
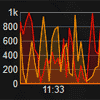
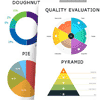
- Creation of all chart types using Google Charts - Visit https://developers.google.com/chart/interactive/docs/gallery
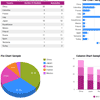
- Extraction of data from HTML tables, Google spreadsheets, and JavaScript arrays
- Accessible data - Using HTML tables as data sources makes data accessible to screen readers and searchbots
- Generation of HTML tables from other data sources - Makes data extracted from JS arrays and Google Sheets accessible
- Showing and hiding of HTML tables accessibly
- Manipulation of data extracted from HTML tables and Google Sheets using JavaScript arrays
- Transposition of data - swapping of rows and columns
- Resizing of charts on screen resize - Responsive Web Design
- Chart aspect ratio control
- Art direction - Zoom and offset of chart - Useful for refining the region displayed in geoCharts
- Customization of chart tooltips and annotations
- Customization of all Google Chart options - Fonts, colors, chart formatting, etc.
- Adding Google Chart event handlers - Event handlers can be defined in the options
How do I get set up?
- Download - Download and extract the Chartinator zip files - https://github.com/jbowyers/chartinator
- Copy files - Copy the chartinator.js file to your project
- Setup the HTML - Open the chartinator.html sample file and copy and paste the desired html into the files in your project. Or, adapt your existing project files to work with chartinator (see Configuration).
- Link to chartinator.js - Add a script references in your HTML files
- Initialize Chartinator - Activate the plugin using jQuery (see Configuration)
Using Bower Package Manager
The Chartinator repo is registered as a bower package as 'chartinator'.
Configuration
The Chartinator repo includes the chartinator.js plugin file as well as sample HTML. To use the plugin you need to:
- Reference the chartinator.js file in your html
- add/modify your HTML tables, Google Sheets or js arrays
- Use jQuery to modify options
Using Data from HTML Tables
Chartinator is designed to extract data from HTML tables. The header cells (th elements) in HTML table must be in the first row (or first column if transposing table) and should have a 'data-type' attribute with one of the following values:
- 'string'
- 'number'
- 'boolean'
- 'date'
- 'datetime'
- 'timeofday'
or a 'data-role' attribute with one of the following values:
- 'tooltip'
- 'annotation'
The caption element's text will be used as a title for the chart by default
You can also restructure the data extracted from an HTML table by adding and replace data with data contained in js data arrays. For example you can add column headers, columns of data and rows of data. You can also remove and replace headers and columns and transpose data.
Sample HTML
<div id="chart_canvas"></div> <table id="chart_data"> <caption>Chart Title</caption> <tr> <th scope="col" data-type="string">Domain Axis Name</th> <th scope="col" data-type="number">Data Axis Name</th> <th scope="col" data-role="tooltip">Tooltip</th> </tr> <tr> <td>Data</td> <td>Data</td> <td>Tooltip text</td> </tr> ...Using Data from Google Sheets
You can also use data from Google Sheets to define chart data. Data extracted from a Google Sheet can be added to and replaced with data contained in js data arrays. For example you can add column headers, columns of data and rows of data. You can also remove and replace headers and columns and transpose data.
To use a Google Sheet as a data source you need to do the following:
- Create the Google Sheet (visit: https://docs.google.com/spreadsheets)
- Make sure your sheet is the only sheet in the Google Sheets document
- Make the sheet public - Choose 'Publish to the Web' from the 'File' menu
- Get the key id from the link url - Should look something like: '1kg6f4UVJPpT45D7ucAE8lhsVp8vIUl7bSMM442_DrhI'
- Set the 'googleSheetKey' option in the jQuery Chartinator options to be the key id
Note: Data is extracted from a Google Sheet as comma separated values (csv) so don't use commas in data
Using Data from JavaScript Arrays
You can also use data from JavaScript arrays you create to completely define the chart data or to add to and replace data extracted from an HTML table or Google Sheet, including the column headers.
The JS data arrays must adhere to the following syntax:
// Columns - The columns data-array columns: [ {label: 'Primary Column Title', type: 'string'}, {label: 'Data Column Title', type: 'number'}, {role: 'tooltip', type: 'string'}], // Rows - The rows data-array rows: [ ['China', 18, '2015 - 18'], ['Japan', 12, '2015 - 12'], ['Russia', 10, '2015 - 10'], ['Mexico', 5, '2015 - 5'], ['Brazil', 6, '2015 - 6'], ['Italy', 4, '2015 - 4']],See https://developers.google.com/chart/interactive/docs/datatables_dataviews#arraytodatatable for more info.
Sample jQuery
The Chart must be initialized using jQuery.
<script src="js/chartinator.js" ></script> <script> jQuery(function ($) { // Bar Chart Example // Use any jQuery selector to select the chart canvas(es) var chart1 = $('#barChart').chartinator({ // Custom Options ------------------------------------------------------ // The Google Sheet key // The id of the Google sheet taken from the public url of the Sheet // Default: false googleSheetKey: '1kg6f4UVJPpT45D7ucAE8lhsVp8vIUl7bSMM442_DrhI', // The data columns js array // An array of object literals that define each column // Default: false //columns: [ // {label: 'Country', type: 'string'}, // {label: 'Students', type: 'number'}, // {role: 'tooltip', type: 'string'}], // Column indexes array - An array of column indexes defining where // the data will be inserted into any existing data extracted // from an HTML table or Google Sheet // Default: false - js data array columns replace any existing columns // Note: when inserting more than one column be sure to // increment index number to account for previously inserted indexes //colIndexes: [2], // Rows - The rows data-array // If colIndexes array has values the row data will be inserted // into the columns defined in the colindexes array. Otherwise // the row data will be appended to any existing row data extracted // from an HTML table or Google Sheet // Default: false //rows: [ // ['China', 18, '2013 - 18'], // ['Japan', 12, '2013 - 12'], // ['Russia', 10, '2013 - 10']], // The jQuery selector of the HTML table to extract the data from. // Default: false - Checks if the element this plugin // is applied to is an HTML table //tableSel: '.barChart', // Ignore row indexes array - An array of row index numbers to ignore // Default: [] // Note: Only works on data extracted from HTML tables or Google Sheets // The headings row is index 0 //ignoreRow: [6,8], // Ignore column indexes array - An array of column indexes to ignore // Default: [] // Note: Only works when extracting data from HTML tables or Google Sheets //ignoreCol: [2], // Transpose data Boolean - swap columns and rows // Default: false // Note: Only works on data extracted from HTML tables or Google Sheets //transpose: false, // The chart type - String // Derived from the Google Charts visualization class name // Default: 'BarChart' // Use TitleCase names. eg. BarChart, PieChart, ColumnChart, Calendar, GeoChart, Table. // See Google Charts Gallery for a complete list of Chart types // https://developers.google.com/chart/interactive/docs/gallery chartType: 'BarChart', // The annotation concatenation // Defines a string for concatenating a custom annotation. // Keywords: 'domain', 'data', 'label' // The keywords will be replaced with current values // 'domain': the primary axis value, // 'data': the data value, // 'label': the column title // Default: false - use Google Charts annotation defaults // Note: Only works when extracting data from HTML tables or Google Sheets. // Not supported on pie, geo, calendar charts annotationConcat: 'domain - label: data', // The chart aspect ratio custom option - width/height // Used to calculate the chart dimensions relative to the width or height // this is overridden if the Google Chart's height and width options have values // Suggested value: 1.25 // Default: false - not used chartAspectRatio: 1.25, // Google Bar Chart Options barChart: { // Width of chart in pixels - Number // Default: automatic (unspecified) width: null, // Height of chart in pixels - Number // Default: automatic (unspecified) //height: 400, chartArea: { left: "20%", top: 40, width: "74%", height: "80%" }, // The font size in pixels - Number // Default: false - Use Google Charts defaults fontSize: 14, // Font-family name - String // Default: The body font-family fontName: 'Roboto', // Chart Title - String // Default: Table caption. title: 'Bar Chart Sample', titleTextStyle: { // The font size in pixels - Number // Or use css selectors as keywords to assign font sizes from the page // For example: 'body' // Default: false - Use Google Charts defaults fontSize: 20 }, legend: { // Legend position - String // Options: bottom, top, left, right, in, none. // Default: 'bottom' position: 'bottom' }, // Array of colours colors: ['#3691ff'], // Stack values within a bar or column chart - Boolean // Default: false. isStacked: false, tooltip: { // Shows tooltip with values on hover - String // Options: focus, none. // Default: focus trigger: 'focus' } }, // Show table as well as chart - String // Options: 'show', 'hide', 'remove' showTable: 'show' }); }); </script>List of Options
The following is a list of useful options with default values. For more information about Google Chart options visit https://developers.google.com/chart/
All chart types options
The following are options that are specific to Chartinator and apply to all chart types unless otherwise specified.
// URL - The path to the Google AJAX API. Default: 'https://www.google.com/jsapi' urlJSAPI: 'https://www.google.com/jsapi', // The Google Sheet key // The id code of the Google sheet taken from the public url of your Google Sheet // Default: false googleSheetKey: false, // The data columns js array // An array of object literals that define each column // Default: false columns: false, // Column indexes array - An array of column indexes defining where // the data will be inserted into any existing data extracted from an // HTML table or Google Sheet // Default: false - js data array columns replace any existing columns // Note: when inserting more than one column be sure to increment index number // to account for previously inserted indexes colIndexes: false, // Rows - The rows data-array // If colIndexes array has values the row data will be inserted into the columns // defined in the colindexes array. Otherwise the row data will be appended // to any existing row data extracted from an HTML table or Google Sheet // Default: false rows: false, // The jQuery selector of the HTML table element to extract the data from. // Default: false - Checks if the element this plugin is applied to is an HTML table tableSel: false, // The data title // A title used to identify the set of data // Used as a caption when generating an HTML table dataTitle: false, // Create Table - String // Create a basic HTML table or a Google Table Chart from chart data // Options: false, 'basic-table', 'table-chart' // Note: This table will replace an existing HTML table createTable: false, // Ignore row indexes array - An array of row index numbers to ignore // Default: [] // Note: Only works on data extracted from HTML tables or Google Sheets // The headings row is index 0 ignoreRow: [], // Ignore column indexes array // An array of column indexes to ignore in the HTML table or Google Sheet // Default: [] // Note: Only works on data extracted from HTML tables or Google Sheets ignoreCol: [], // Transpose data Boolean - swap columns and rows // Default: false // Note: Only works on data extracted from HTML tables or Google Sheets transpose: false, // The tooltip concatenation - Defines a string for concatenating a custom tooltip. // Keywords: 'domain', 'data', 'label' - these will be replaced with current values // 'domain': the primary axis value, 'data': the data value, 'label': the column title // Default: false - use Google Charts tooltip defaults // Note: Only works when extracting data from HTML tables or Google Sheets // Not supported on pie, calendar charts tooltipConcat: false, // The annotation concatenation - Defines a string for concatenating a custom annotation. // Keywords: 'domain', 'data', 'label' - these will be replaced with current values // 'domain': the primary axis value, 'data': the data value, 'label': the column title // Default: false - use Google Charts annotation defaults // Note: Only works when extracting data from HTML tables or Google Sheets. // Not supported on pie, geo, calendar charts annotationConcat: false, // The chart type - String // Derived from the Google Charts visualization class name // Default: 'BarChart' // Use TitleCase names. eg. BarChart, PieChart, ColumnChart, Calendar, GeoChart, Table. // See Google Charts Gallery for a complete list of Chart types // https://developers.google.com/chart/interactive/docs/gallery chartType: 'BarChart', // Chart Id - The id applied to the chart container element as an id and a class // This is overridden if the chart element has an id or the id is user defined chartId: 'c24_' + Math.random().toString(36).substr(2, 9), // The class to apply to the dynamically created chart container element chartClass: 'chtr-chart', // Table Id - The id applied to the table element as an id and a class // This is overridden if the table element has an id or is user defined tableId: 'c24_table_' + Math.random().toString(36).substr(2, 9), // The class to apply to the table element tableClass: 'chtr-table', // The chart aspect ratio custom option - width/height // Used to calculate the chart dimensions relative to the width or height // this is overridden if the Google Chart's height and width options have values // Default: false - not used chartAspectRatio: false, // The chart zoom factor - number // A scaling factor for the chart - uses CSS3 transform // To prevent tooltips from displaying off canvas when zooming, set tooltip.isHtml: true // Default: 0 chartZoom: 0, // The chart offset - Array of numbers // An array of x and y offset percentage values // Used to offset the chart by percentages of the height and width - uses CSS3 transform // To prevent tooltips from displaying off canvas when offsetting, set tooltip.isHtml: true // Default: false chartOffset: false, // The chart event objects array // An array of objects containing Google Chart event types and handlers // Each object must contain an 'event' and a 'handler' name value pair // Example: [{ 'event': 'select', 'handler': function (e) { ... }}] // Default: false chartEvents: false, // The Google Chart Options // This option can be used with any chart type // Some chart types have default options defined within Chartinator by the following objects: // barChart, pieChart, columnChart, calendar, table, areaChart, lineChart // These objects should be used instead of this one when using those chart types // Default: no default - not defined chartOptions: {}, // Google Bar Chart Options - Object Literal // This should be used instead of the chartOptions object when creating a bar chart //barChart: {}, // Google Pie Chart Options - Object Literal // This should be used instead of the chartOptions object when creating a pie chart //pieChart: {}, // Google Column Chart Options - Object Literal // This should be used instead of the chartOptions object when creating a column chart //columnChart: {}, // Google Line Chart Options - Object Literal // This should be used instead of the chartOptions object when creating a line chart //lineChart: {}, // Google Area Chart Options - Object Literal // This should be used instead of the chartOptions object when creating a area chart //areaChart: {}, // Google Geo Chart Options - Object Literal // This should be used instead of the chartOptions object when creating a area chart //geoChart: {}, // Google Calendar Chart Options - Object Literal // This should be used instead of the chartOptions object when creating a calendar chart //calendar: {}, // Google Table Chart Options - Object Literal // This should be used instead of the chartOptions object when creating a table chart //table: {}, // Show table along with chart - String // Options: 'show', 'hide', 'remove'. Default: 'hide' showTable: 'hide', // The CSS literal used to show the table. showTableCSS: { 'position': 'static', 'top': 0 }, // The CSS literal used to hide the table. hideTableCSS: { 'position': 'absolute', 'top': '-9999px', 'width': $tableS.width() }, // The CSS literal used to show the chart. showChartCSS: { }, // The CSS literal used to hide the chart. hideChartCSS: { 'opacity': 0} Google Bar Chart Options
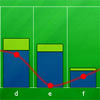
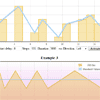
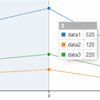
The following are some of the Google Charts Bar Chart options, unless otherwise specified.
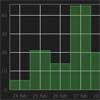
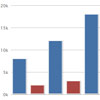
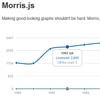
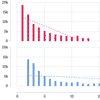
// Google Bar Chart Options - Object Literal barChart: { // Width of chart in pixels - Number // Default: automatic (unspecified) width: null, // Height of chart in pixels - Number // Default: automatic (unspecified) height: 200, chartArea: { left: "20%", top: 40, width: "75%", height: "85%" }, // The font size in pixels - Number // Or use css selectors as keywords to assign font sizes from the page // For example: 'body' // Default: false - Use Google Charts defaults fontSize: 'body', // Font-family name - String // Default: The body font-family fontName: 'Arial', // Chart Title - String // Default: Table caption. title: 'Bar Chart Sample', titleTextStyle: { // The font size in pixels - Number // Or use css selectors as keywords to assign font sizes from the page // For example: 'body' // Default: Google Charts defaults fontSize: 'h3', }, legend: { // Legend position - String // Options: bottom, top, left, right, in, none. // Default: 'bottom' position: 'right' }, // Array of colours colors: ['#3691ff'], // Stack values within a bar or column chart - Boolean // Default: false. isStacked: false, tooltip: { // Shows tooltip with values on hover - String // Options: focus, none. // Default: focus trigger: 'focus' } },For a complete list of Bar chart options visit Google Bar Charts
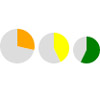
Google Pie Chart Options
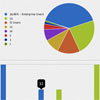
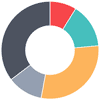
The following are some of the Google Charts Pie Chart options, unless otherwise specified.
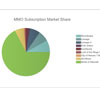
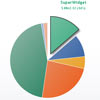
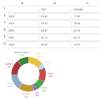
// Google Pie Chart Options pieChart: { // Width of chart in pixels - Number // Default: automatic (unspecified) width: null, // Height of chart in pixels - Number // Default: automatic (unspecified) height: 200, chartArea: { // The chart proportions left: "20%", top: 40, width: "60%", height: "85%" }, // The font size in pixels - Number // Or use css selectors as keywords to assign font sizes from the page // For example: 'body' // Default: false - Use Google Charts defaults fontSize: 'body', // The font family name. String // Default: body font family fontName: 'Arial', // Chart Title. String // Default: The table caption text. title: 'Chart Title', titleTextStyle: { // The font size in pixels - Number // Or use css selectors as keywords to assign font sizes from the page // For example: 'body' // Default: false - Use Google Charts defaults fontSize: 'h3', }, legend: { // Legend position - Controls display of legend. String // Options: 'bottom', 'top', 'left', 'right', 'in', 'none'. position: 'right' }, // Array of colours colors: ['#90A046', '#90A046'], // Makes chart 3D. Boolean, Default: false. is3D: false, tooltip: { // String - Shows tooltip with values on hover. // Options: 'focus', 'none'. Default: focus trigger: 'focus', } },For a complete list of Pie Chart options visit Google Pie Charts
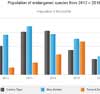
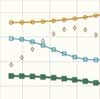
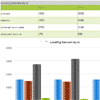
Google Column Chart Options
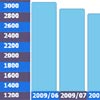
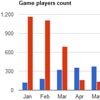
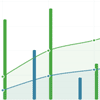
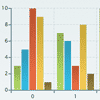
The following are some of the Google Charts Column Chart options, unless otherwise specified.
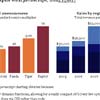
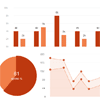
// Google Column Chart Options columnChart: { // Width of chart in pixels - Number // Default: automatic (unspecified) width: null, // Height of chart in pixels - Number // Default: automatic (unspecified) height: 200, chartArea: { // The chart proportions left: "20%", top: 40, width: "60%", height: "85%" }, // The font size in pixels - Number // Or use css selectors as keywords to assign font sizes from the page // For example: 'body' // Default: false - Use Google Charts defaults fontSize: 'body', // The font family name - String // Default: body font family fontName: 'Arial', // Chart Title - String // Default: The table caption text. title: 'Chart Title', titleTextStyle: { // The font size in pixels - Number // Or use css selectors as keywords to assign font sizes from the page // For example: 'body' // Default: false - Use Google Charts defaults fontSize: 'h3', }, legend: { // Legend position - Controls display of legend. String // Options: 'bottom', 'top', 'left', 'right', 'in', 'none'. Default: 'bottom' position: 'right' }, // Array of colours colors: ['#90A046', '#90A046'], // Stack values within a bar or column chart. Boolean, Default: false. isStacked: false, tooltip: { // String - Shows tooltip with values on hover. // Options: 'focus', 'none'. Default: focus trigger: 'focus', } },For a complete list of Column Chart options visit Google Column Charts
Google Geo Chart Options
The following are some of the Google Charts Geo Chart options, unless otherwise specified.
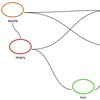
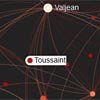
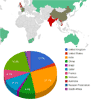
// Google Geo Chart Options geoChart: { // Width of chart in pixels - Number // Default: automatic (unspecified) width: null, // Height of chart in pixels - Number // Default: automatic (unspecified) height: 200, // The chart title - not a Google Geo Chart option // This option is supported by Chartinator only title: 'Geo Chart', titleTextStyle: { // Note: Support for this option has been added by Chartinator // but is not supported by Google Charts for this chart type // The html tag that contains the title Chartinator adds to the top of the chart // This is supported by Chartinator only tag: 'h3' } // Background Color - Default: 'white' backgroundColor: '#fff', // Dataless Region Color - Default: '#F5F5F5' datalessRegionColor: '#F5F5F5', // Map Region - String, Options: 'world', continent, region, country, states. // Default: 'world' region: 'world', // Resolution - String // Options: 'countries', 'provinces', 'metros'. Default: 'countries' resolution: 'countries', legend: { // Legend position - Controls display of legend. String // Options: 'bottom', 'top', 'left', 'right', 'in', 'none'. Default: right position: 'right' }, colorAxis: { // Start and end colour gradient values. Default: null colors: [] }, tooltip: { // String - Shows tooltip with values on hover. // Options: 'focus', 'none'. Default: focus trigger: 'focus', } },Note: Google Charts does not apply a heading to this chart type. Chartinator adds a heading using either the caption from the HTMl data table or the chartTitle option. For a complete list of Geo Chart options visit Google Geo Charts
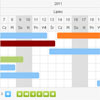
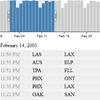
Google Calendar Chart Options
The following are some of the Google Charts Calendar Chart options, unless otherwise specified.
// Google Calendar Chart Options calendar: { // The cell scaling factor custom option - Not a Google Chart option // Used to refactor the cell size in responsive designs // this is overridden if the calendar.cellSize option has a value cellScaleFactor: 0.017, // Width of chart in pixels - Number // Default: automatic (unspecified) width: null, // Height of chart in pixels - Number // Default: automatic (unspecified) height: 200, titleTextStyle: { // Note: Support for this option has been added by Chartinator // but is not supported by Google Charts for this chart type color: '#000', fontWeight: 'bold', fontName: 'Arial', // Default is body font-family // The font size in pixels - Number // Or use css selectors as keywords to assign font sizes from the page // For example: 'body' // Default: '' - Use Google Charts defaults fontSize: 'h3' }, calendar: { // Cell size in pixels. Number, // Default: use cellScaleFactor cellSize: 16, monthLabel: { // Font-family name - String // Default: the body font-family fontName: 'Times-Roman', // The font size in pixels - Number // Or use css selectors as keywords to assign font sizes from the page // For example: 'body' // Default: false - Use Google Charts defaults fontSize: 'body', }, dayOfWeekLabel: { // Font-family name - String // Default: the body font-family fontName: 'Arial' // The font size in pixels - Number // Or use css selectors as keywords to assign font sizes from the page // For example: 'body' // Default: false - Use Google Charts defaults fontSize: 12, }, monthOutlineColor: { // The active month outline stroke colour. String, Default: #000 stroke: '#000', } }, colorAxis: { // The colour gradient start and end values colors: ['#FF0000', '#00FF00'] }, tooltip: { // Note: Support for this option has been added by Chartinator // but is not supported by Google Charts for this chart type textStyle: { color: '#000', fontName: 'Arial', // Default: body font-family fontSize: 16 } } },For a complete list of Calendar Chart options visit Google Calendar Charts
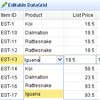
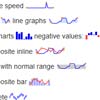
Google Table Chart Options
The following are some of the Google Charts Table Chart options, unless otherwise specified.
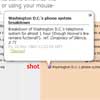
// Google Table Chart Options table: { // The table caption - not a Google Charts option for this chart type // Chartinator option only title: 'Table Chart', // The font size in pixels - Number // Or use css selectors as keywords to assign font sizes from the page // For example: 'body' // Not a Google Charts option for this chart type fontSize: 16, // The table caption - not a Google Charts option for this chart type // Chartinator option only // Default: the body font-family fontName: 'Roboto', // Format a data column in a Table Chart formatter: { // Formatter type - String, Options: 'none', 'BarFormat'. Default: 'none' type: 'none', // The index number of the column to format - Integer // Options: 0, 1, 2, etc. Default: 1 column: 1, // Base value number to compare the cell value against. Default: 0 base: 0, // Negative bar color - String // Options: 'red', 'green', 'blue'. Default: 'red' colorNegative: 'red', // Positive bar color - String // Options:'red', 'green', 'blue'. Default: 'blue' colorPositive: 'green', // Dark base line when negative values are present. // Default value is 'false' drawZeroLine: false, // Maximum bar value. Number, Default: highest value in table max: , // Minimum bar value. Number, Default; lowest value in the table min: , // Show number values. Boolean, Default: true showValue: true, // Thickness of each bar in pixels. Number, Default: 100 width: 100 }, // Allow HTML in cells. Boolean, default: true allowHtml: true, // Alternating row styling - Boolean, Default: true alternatingRowStyle: true, // Width of chart in pixels. Number, Default: automatic (unspecified) width: , // Height of chart in pixels. Number, Default: automatic (unspecified) height: , // Enable paging - String, Options: enable, event, disable. Default: disable page: 'disable', // Rows per page. Integer, Default 10 pageSize: 10, // Enable row numbers. Boolean, Default: false showRowNumber: false, // Enables sorting. String, Options: enable, event, disable. Default: enable sort: 'enable', // Sort order. Boolean, Default: true sortAscending: true, // The index of a column to sort. Integer, Default: -1 sortColumn: -1, // CSS class names - Default: no classes cssClassNames: { headerRow: 'headerRow', tableRow: 'tableRow', oddTableRow: 'oddTableRow', selectedTableRow: 'selectedTableRow', hoverTableRow: 'hoverTableRow', headerCell: 'headerCell', tableCell: 'tableCell', rowNumberCell: 'rowNumberCell' } },Note: Google Charts does not apply a table caption to this chart. Chartinator adds a caption to the table taken from either the HTML data table or the chartTitle option. For a complete list of Table Chart options visit Google Table Charts
Styling Tooltips
Google Charts HTML enabled tooltips can be styled using the relevant CSS classes. Chartinator adds a style element to the head of the document to apply custom styles to tooltips for for certain chart types. The default Google Charts tooltip CSS is located at: https://ajax.googleapis.com/ajax/static/modules/gviz/1.0/core/tooltip.css
Dependencies
jQuery, Google Charts
How to run tests
No testing framework at this time
Task Managers
Gruntfile.js and package.json files are included if you want to manage tasks using Grunt.
Note: The Grunt file uses configuration information contained in the package.json
Deployment instructions
The git repo is versioned and includes a Bower configuration file so the repo can be easily included in your project as a dependency.
Contribution guidelines
Contributions are much appreciated and welcomed.
Who do I talk to?
jbowyers