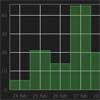
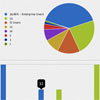
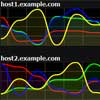
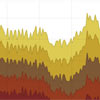
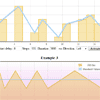
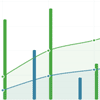
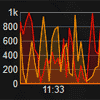
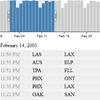
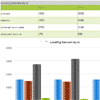
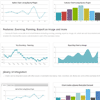
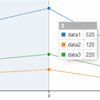
 dygraphs is an open source JavaScript library that produces produces interactive, zoomable charts of time series. It is designed to display dense data sets and enable users to explore and interpret them.FeaturesPlots time series without using an external server or FlashWorks in Internet Explorer (using excanvas)Lightweight (45kb) and responsiveDisplays values on mouseover (this makes it easily discoverable)Supports error bands around data seriesInteractive zoomAdjustable averaging periodCan intelligently chart fractionsCustomizable click-through actionsCompatible with the Google Visualization APIIntelligent defaults make it easy to use
You May Also Like


jQuery Plugins
- 3D Slider
- AutoComplete
- Barcode
- Blur Effect
- Calculator
- Captcha
- Checkbox
- Color Picker
- Confirm Dialog
- Context Menu
- Cookies
- Countdown Timer
- Coverflow
- Currency Format
- DateTime Picker
- Dialog
- Editable
- Event Calendar
- File Upload
- Filter
- Fixed Header
- Flipbook
- Form Submit
- Form Validation
- Form Wizard
- Fullscreen
- Geolocation
- Grid
- History
- Html5 Audio Player
- HTML5 canvas
- Html5 Local Storage
- Html5 Video Player
- Image Crop
- Image Hover Effect
- Lazy Load
- Login
- Mask
- Mega Menu
- MultiSelect
- News Ticker
- Notification
- Parallax
- Placeholder
- Portfolio
- Preloader
- Progress Bar
- Range Slider
- Rating
- Rotate Image
- Scrollbar
- Scrolling Effects
- SelectBox
- Shopping Cart
- Side Menu
- Social Share
- Sorting
- Timeline
- Tooltip
- Treeview
- Video Background
- Weather
- Website Tour
- Wysiwyg Editor
- YouTube
AngularJs Plugins
- Accordion
- Animation
- Application
- Autocomplete
- Bootstrap
- Calendar
- Carousel
- Chart_Graph
- Date_Time
- Drag_Drop
- Forms
- Gallery
- Maps
- Menu_Navigation
- Modal_Popup
- Plugins
- Premium
- Slider
- Table
- Tabs
- Text Effects
- Tutorials
- Video_Audio
- Zoom