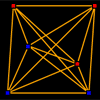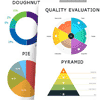
jQuery Spidergraph Plugin - Dynamic, interactive spidergraphs in HTML5
jquery.spidergraph is a simple module that creates nice looking, interactive spidergraphs in HTML5, using the canvas element.
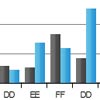
What are spidergraphs good for?
- illustrating scaled quantitative data for several subjective attributes
- overlaying multiple data measurements for attribute comparison
- visualizing the intersection of several data measurements
How do I use it?
First make a div to contain your graph:
<style> #spidergraphcontainer { width: 600px; height: 600px; } </style> <div id="spidergraphcontainer"></div> Apply the spidergraph and tell it what the data fields are. The spidergraph and labels will be drawn to fill the specified div.
$('#spidergraphcontainer').spidergraph({ 'fields': ['a','b','c','d','e'], 'gridcolor': 'rgba(20,20,20,1)' }); Add static layers to your data set. Opacity can be used to see through multiple layers.
$('#spidergraphcontainer').spidergraph('addlayer', { 'strokecolor': 'rgba(230,204,0,0.8)', 'fillcolor': 'rgba(230,204,0,0.6)', 'data': [5, 4, 9, 8, 1] }); $('#spidergraphcontainer').spidergraph('addlayer', { 'strokecolor': 'rgba(230,204,230,0.8)', 'fillcolor': 'rgba(230,204,230,0.6)', 'data': [5, 4, 9, 8, 1] }); Add a dynamic layer that allows mouse and iPad touch input to control the graph.
$('#spidergraphcontainer').spidergraph('setactivedata', { 'strokecolor': 'rgba(0,204,230,0.8)', 'fillcolor': 'rgba(0,204,230,0.6)', 'data': [5, 5, 5, 5, 5] }); Respond to changes in user input on the active layer.
$('#spidergraphcontainer').bind('spiderdatachange', function( ev, data ) { alert( 'first field value is ' + data[0] ); }); Reset all of the data layers in the spidergraph.
$('#spidergraphcontainer').spidergraph('resetdata'); If you wish to use a linear style layer (no curves), simply add attribute 'linear' with value true.
$('#spidergraphcontainer').spidergraph('addlayer', { 'strokecolor': 'rgba(230,204,230,0.8)', 'fillcolor': 'rgba(230,204,230,0.6)', 'data': [5, 4, 9, 8, 1], 'linear': true }); Can I see an example?
Yes you can. Right over here: http://jmstriegel.github.com/jquery.spidergraph/