![]()
Chartify
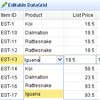
This is a jQuery plugin that takes data in <table> form and transforms it into Google Charts <img> elements.
Chartify can be downloaded here.
Requirements
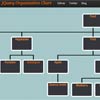
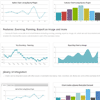
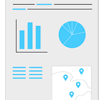
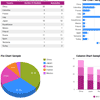
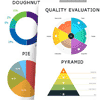
Currently supported chart types
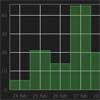
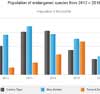
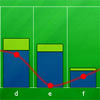
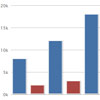
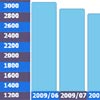
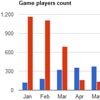
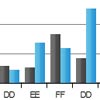
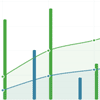
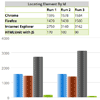
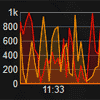
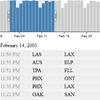
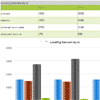
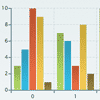
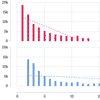
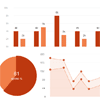
- Bar charts
- Grouped
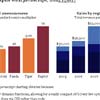
- Stacked
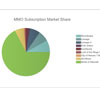
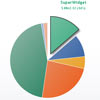
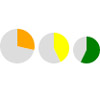
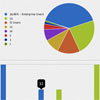
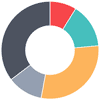
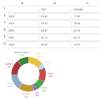
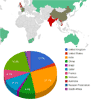
- Pie charts
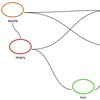
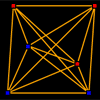
- Venn charts
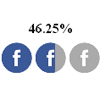
- A simple gender diagram
Implementation
Include jQuery and the plugin.
<script type="text/javascript" src="https://ajax.googleapis.com/ajax/libs/jquery/1.5.1/jquery.min.js"></script> <script type="text/javascript" src="javascripts/chartify.js"></script>Call the plugin function on the desired table elements with the chart type as parameter (bar, pie, venn or gender) and an optional options object.
$('.my-bar-charts').chartify('bar');var options = {chartWidth: 530, colors: ["000000", "666666", "cccccc"]}; $('#my-pie-chart').chartify('pie', options);
More examples of table markup can be found in index.html
Options and defaults
When called without an options parameter, the following defaults are used.
var settings = { chartWidth: 496, // in pixels chartHeight: 180, marginTop: 0, marginRight: 0, marginBottom: 0, marginLeft: 0, legendWidth: 0, legendHeight: 0, pieChartRotation: 0, // in radians unit: '', // appended to labels and values textSize: 11, textColor: "666666", colors: ["ff9daa","ffc000","007ec6","433840","6cc05c","ff710f","ED1F27","95a8ad","0053aa"], xAxisBoundaries:'auto', xAxisStep: 'auto', axisTickSize: 5, showLabels: true, showLegend: true, legendPosition: '', isStacked: false, isDistribution: false, barWidth: 20, barSpacing: 2, groupSpacing: 10, imageClass: '' };To override any of these defaults for a single call to chartify, use the options parameter.
To override any of the default settings globally, i.e. for all subsequent calls to chartify, use the settings method:
$().chartify('settings', {showLegend: false});When called without the parameter, the settings method returns the current default settings hash.
Future development
There are obviously several areas where improvements could be made. First of all: more chart types should really be supported.
I’m working on it…
Problems and suggestions
If you find an error or have a suggestion for future development, please report an issue.
Known issues
- The pie chart method doesn’t fully support chart type “pc” (concentric pie chart)
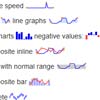
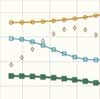
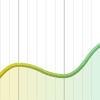
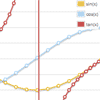
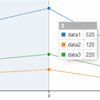
- No support for line charts and area charts
- No support for vertical bar charts
- The axis labels support is not fully implemented
- The gender chart should be developed to support any number of categories
Contribution
If you want to build on this (e.g. add support for more chart types), please send a Pull Request.
License
Chartify is dual licensed under the MIT and GPL licenses.
More information
Chartify was originally developed as part of Daytona Labs, the research program of the digital agency Daytona. Daytona is based in Stockholm, Sweden.
Project homepage
Author
Rasmus Sellberg, @rsellberg