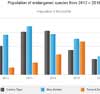
 Graphs of financial projections, quarterly sales figures and market saturation are a middle-manager’s dream.How can we as Web designers get in on all of this hot graph action? There are actually quite a few ways to display graphs on the Web. We could simply create an image and nail it to a Web page. But that’s not very accessible or interesting. We could use Flash, which is quite good for displaying graphs?—?but again, not very accessible. Besides, designers, developers and deities are falling out of love with Flash. Technologies such as HTML5 can do many of the same things without the need for a plug-in. The new HTML5 <canvas> element could even be adapted to the task. Plenty of charting tools are online that we might use.
You May Also Like


jQuery Plugins
- 3D Slider
- AutoComplete
- Barcode
- Blur Effect
- Calculator
- Captcha
- Checkbox
- Color Picker
- Confirm Dialog
- Context Menu
- Cookies
- Countdown Timer
- Coverflow
- Currency Format
- DateTime Picker
- Dialog
- Editable
- Event Calendar
- File Upload
- Filter
- Fixed Header
- Flipbook
- Form Submit
- Form Validation
- Form Wizard
- Fullscreen
- Geolocation
- Grid
- History
- Html5 Audio Player
- HTML5 canvas
- Html5 Local Storage
- Html5 Video Player
- Image Crop
- Image Hover Effect
- Lazy Load
- Login
- Mask
- Mega Menu
- MultiSelect
- News Ticker
- Notification
- Parallax
- Placeholder
- Portfolio
- Preloader
- Progress Bar
- Range Slider
- Rating
- Rotate Image
- Scrollbar
- Scrolling Effects
- SelectBox
- Shopping Cart
- Side Menu
- Social Share
- Sorting
- Timeline
- Tooltip
- Treeview
- Video Background
- Weather
- Website Tour
- Wysiwyg Editor
- YouTube
AngularJs Plugins
- Accordion
- Animation
- Application
- Autocomplete
- Bootstrap
- Calendar
- Carousel
- Chart_Graph
- Date_Time
- Drag_Drop
- Forms
- Gallery
- Maps
- Menu_Navigation
- Modal_Popup
- Plugins
- Premium
- Slider
- Table
- Tabs
- Text Effects
- Tutorials
- Video_Audio
- Zoom