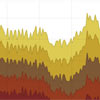
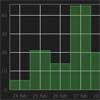
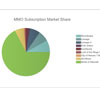
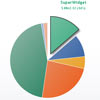
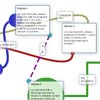
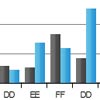
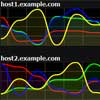
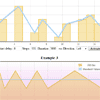
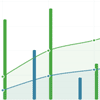
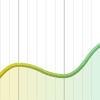
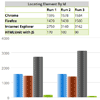
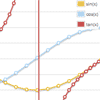
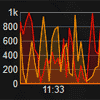
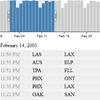
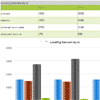
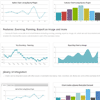
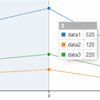
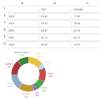
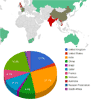
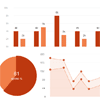
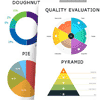
 JavaScript toolkit for creating interactive real-time graphs.Rickshaw provides the elements you need to create interactive graphs: renderers, legends, hovers, range selectors, etc. You put the pieces together.It’s all based on d3 underneath, so graphs are drawn with standard SVG and styled with CSS. Customize all you like with techniques you already know.A few extensions require jQuery, but here all we need is d3 and the Rickshaw library itself. Instantiate a graph, and then render it. For more along this path, check out the tutorial and also see our examples listing.
You May Also Like


jQuery Plugins
- 3D Slider
- AutoComplete
- Barcode
- Blur Effect
- Calculator
- Captcha
- Checkbox
- Color Picker
- Confirm Dialog
- Context Menu
- Cookies
- Countdown Timer
- Coverflow
- Currency Format
- DateTime Picker
- Dialog
- Editable
- Event Calendar
- File Upload
- Filter
- Fixed Header
- Flipbook
- Form Submit
- Form Validation
- Form Wizard
- Fullscreen
- Geolocation
- Grid
- History
- Html5 Audio Player
- HTML5 canvas
- Html5 Local Storage
- Html5 Video Player
- Image Crop
- Image Hover Effect
- Lazy Load
- Login
- Mask
- Mega Menu
- MultiSelect
- News Ticker
- Notification
- Parallax
- Placeholder
- Portfolio
- Preloader
- Progress Bar
- Range Slider
- Rating
- Rotate Image
- Scrollbar
- Scrolling Effects
- SelectBox
- Shopping Cart
- Side Menu
- Social Share
- Sorting
- Timeline
- Tooltip
- Treeview
- Video Background
- Weather
- Website Tour
- Wysiwyg Editor
- YouTube
AngularJs Plugins
- Accordion
- Animation
- Application
- Autocomplete
- Bootstrap
- Calendar
- Carousel
- Chart_Graph
- Date_Time
- Drag_Drop
- Forms
- Gallery
- Maps
- Menu_Navigation
- Modal_Popup
- Plugins
- Premium
- Slider
- Table
- Tabs
- Text Effects
- Tutorials
- Video_Audio
- Zoom