Cubism.js
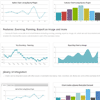
Cubism.js is a D3 plugin for visualizing time series. Use Cubism to construct better realtime dashboards, pulling data from Graphite, Cube and other sources. Cubism is available under the Apache License.
Want to learn more? See the wiki.
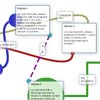
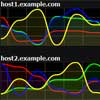
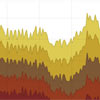
 Cubism.js is a plugin for D3.js, a JavaScript visualization library for HTML and SVG, to display time series in real-time. It has built-in support for Graphite and Cube, and can be readily extended to fetch data from other sources. It requests the data incrementally by polling only the most recent values and reduces the load on the server. Charts are rendered incrementally as well by shifting charts one pixel each time to the left.
Cubism.js is a D3 plugin for visualizing time series. Use Cubism to construct better realtime dashboards, pulling data from Graphite, Cube and other sources. Cubism is available under the Apache License.
Want to learn more? See the wiki.