Dailychart.js


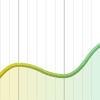
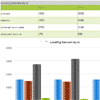
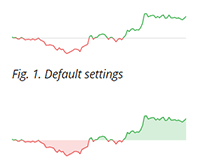
Dailychart.js is a tiny standalone SVG charting library to display daily graph of a stock market security. Try the demo.
Installation
Download from NPM
npm install dailychartInclude the library
var Dailychart = require('dailychart');of include the file
<script src='./path/to/dailychart.js'></script>Usage
HTML
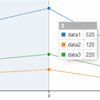
<div id="chart" data-dailychart-values="12.94,13.0,12.98,13.02,13.0,13.0,12.95,12.85,13.04,13.13" data-dailychart-close="13.08" data-dailychart-length="78"> </div>CSS
#chart { width: 80px; height: 30px; }JavaScript
var el = document.getElementById('chart'); new Dailychart(el, [options]);Options
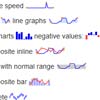
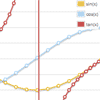
width- Chart width. If not set it equals to container's width.height- Chart height. If not set it equals to container's height.lineWidth- Line width of the graph (default: 1).colorPositive- Color of the positive part of the graph (default: '#33AE45').colorNegative- Color of the negative part of the graph (default: '#EB5757').fillPositive- Fill color of the positive area (default: '').fillNegative- Fill color of the negative area (default: '').closeWidth- Width of the close line (default: 1).closeColor- Color of the close line (default: '#e0e0e0').
HTML Attributes
data-dailychart-values- Comma delimited data points for the graph.data-dailychart-length- Number of points in the trading session.data-dailychart-close- Close value of previous trading session.