venn.js 


A javascript library for laying out area proportional venn and euler diagrams.
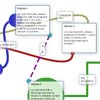
Details of how this library works can be found on the blog post I wrote about this. A follow up post discusses testing strategy and algorithmic improvements.
Installing
If you use NPM, npm install venn.js. Otherwise, download the latest release.
Usage
This library depends on d3.js to display the venn diagrams.
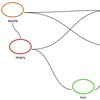
Simple layout
To lay out a simple diagram, just define the sets and their sizes along with the sizes of all the set intersections.
The VennDiagram object will calculate a layout that is proportional to the input sizes, and display it in the appropriate selection when called:
var sets = [ {sets: ['A'], size: 12}, {sets: ['B'], size: 12}, {sets: ['A','B'], size: 2}]; var chart = venn.VennDiagram() d3.select("#venn").datum(sets).call(chart);Changing the Style
The style of the Venn Diagram can be customized by using D3 after the diagram has been drawn. For instance to draw a Venn Diagram with white text and a darker fill:
var chart = venn.VennDiagram() d3.select("#inverted").datum(sets).call(chart) d3.selectAll("#inverted .venn-circle path") .style("fill-opacity", .8); d3.selectAll("#inverted text").style("fill", "white");View this example, along with other possible styles
Dynamic layout
To have a layout that reacts to a change in input, all that you need to do is update the dataset and call the chart again:
// draw the initial diagram var chart = venn.VennDiagram() d3.select("#venn").datum(getSetIntersections()).call(chart); // redraw the diagram on any change in input d3.selectAll("input").on("change", function() { d3.select("#venn").datum(getSetIntersections()).call(chart); });Making the diagram interactive
Making the diagram interactive is basically the same idea as changing the style: just add event listeners to the elements in the venn diagram. To change the text size and circle colours on mouseover:
d3.selectAll("#rings .venn-circle") .on("mouseover", function(d, i) { var node = d3.select(this).transition(); node.select("path").style("fill-opacity", .2); node.select("text").style("font-weight", "100") .style("font-size", "36px"); }) .on("mouseout", function(d, i) { var node = d3.select(this).transition(); node.select("path").style("fill-opacity", 0); node.select("text").style("font-weight", "100") .style("font-size", "24px"); });Adding tooltips
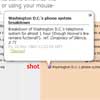
Another common case is adding a tooltip when hovering over the elements in the diagram. The only tricky thing here is maintaining the correct Z-order so that the smallest intersection areas are on top, while still making the area that is being hovered over appear on top of the others:
// draw venn diagram var div = d3.select("#venn") div.datum(sets).call(venn.VennDiagram()); // add a tooltip var tooltip = d3.select("body").append("div") .attr("class", "venntooltip"); // add listeners to all the groups to display tooltip on mouseover div.selectAll("g") .on("mouseover", function(d, i) { // sort all the areas relative to the current item venn.sortAreas(div, d); // Display a tooltip with the current size tooltip.transition().duration(400).style("opacity", .9); tooltip.text(d.size + " users"); // highlight the current path var selection = d3.select(this).transition("tooltip").duration(400); selection.select("path") .style("stroke-width", 3) .style("fill-opacity", d.sets.length == 1 ? .4 : .1) .style("stroke-opacity", 1); }) .on("mousemove", function() { tooltip.style("left", (d3.event.pageX) + "px") .style("top", (d3.event.pageY - 28) + "px"); }) .on("mouseout", function(d, i) { tooltip.transition().duration(400).style("opacity", 0); var selection = d3.select(this).transition("tooltip").duration(400); selection.select("path") .style("stroke-width", 0) .style("fill-opacity", d.sets.length == 1 ? .25 : .0) .style("stroke-opacity", 0); });Released under the MIT License.