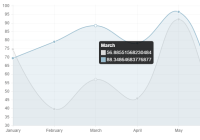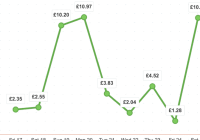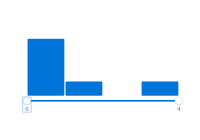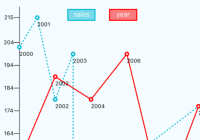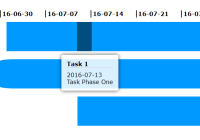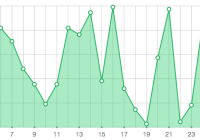
react-svg-line-chart


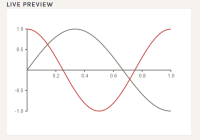
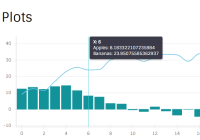
A lightweight responsive line chart component for React using only SVG
Getting started
You can download react-svg-line-chart from the NPM registry via the npm or yarn commands
yarn add react-svg-line-chart npm install react-svg-line-chart --saveIf you don't use package manager and you want to include react-svg-line-chart directly in your html, you could get it from the UNPKG CDN
https://unpkg.com/react-svg-line-chart/umd/react-svg-line-chart.jsDemo
See Demo page
Usage
import React from 'react' import LineChart from 'react-svg-line-chart' const data = [] for (let x = 1; x <= 30; x++) { data.push({ x: x, y: Math.floor(Math.random() * (100)) }) } export default class MyComponent extends React.Component { state = { activePoint: null, } handlePointHover = (activePoint, e) => { this.setState({activePoint}) } render() { const {activePoint} = this.state return ( <LineChart data={data.map((point, i) => ({...point, active: point.x === activePoint.x ? true : false}))} pointsOnHover={this.handlePointHover} /> ) } }Props
| Name | PropType | Description | Default |
|---|---|---|---|
| areaColor | String | Area color (hex, rgb...) | "#34495e" |
| areaOpacity | Number | Area opacity | .5 |
| areaVisible | Boolean | Area visibility | false |
| axisColor | Number | Axis color | "#34495e" |
| axisOpacity | Number | Axis opacity | .5 |
| axisVisible | Boolean | Axis visibility | true |
| axisWidth | Number | Axis width | 1 |
| data | Array of data Objects | data is {x: number, y: number, active: bool}) | [] |
| gridColor | String | Grid color | "#34495e" |
| gridOpacity | Number | Grid color | .5 |
| gridVisible | Boolean | Grid visibility | true |
| gridWidth | Number | Grid width | 1 |
| labelsCharacterWidth | Number | Labels character with (depending on your font) to calculate the width of Y labels | 10 |
| labelsColor | String | Labels color | "#34495e" |
| labelsCountY | Number | Y labels count | 5 |
| labelsFormatX | Function | Custom X labels | x => x |
| labelsFormatY | Function | Custom Y labels | y => y |
| labelsHeightX | Number | X labels height (depending on your font) | 12 |
| labelsOffsetX | Number | X labels offset | 15 |
| labelsOffsetY | Number | Y labels offset | 15 |
| labelsStepX | Number | X labels step | 1 |
| labelsVisible | Number | Labels visibility | true |
| pathColor | String | Path color | "#34495e" |
| pathOpacity | Number | Path opacity | 1 |
| pathSmoothing | Number | Between 0 and 1 or null to disable | null |
| pathVisible | Boolean | Path visibility | false |
| pathWidth | Number | Path width | 1 |
| pointsColor | String | Points color | "#fff" |
| pointsIsHoverOnZone | Boolean | pointsOnHover function callback called on zone hover instead of points hover | false |
| pointsOnHover | Function | Callback when one point is hovered | (point, event) => {} |
| pointsRadius | Number | Points radius | 4 |
| pointsStrokeColor | String | Points stroke color | "#34495e" |
| pointsStrokeWidth | Number | Points stroke width | 2 |
| pointsVisible | Boolean | Points visibility | true |
| viewBoxHeight | Number | SVG viewport height | 300 |
| viewBoxWidth | Number | SVG viewport width | 800 |
Contributing
- ⇄ Pull/Merge requests and ★ Stars are always welcome.
- For bugs and feature requests, please create an issue.
- Pull requests must be accompanied by passing automated tests (
npm test).
See CONTRIBUTING.md guidelines
Changelog
See changelog
License
This project is licensed under the MIT License - see the LICENCE.md file for details