react-chartjs
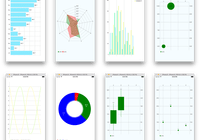
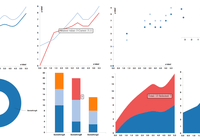
rich interactive react charting components using chart.js including
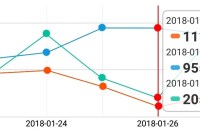
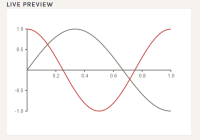
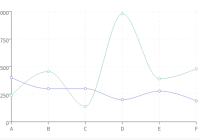
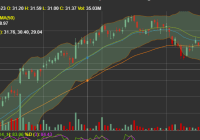
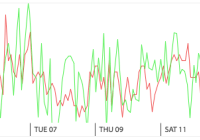
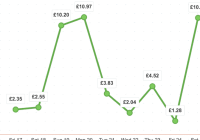
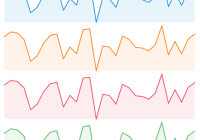
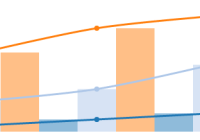
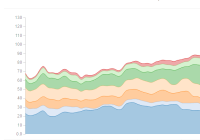
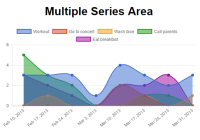
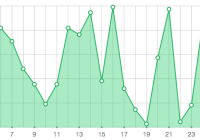
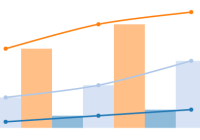
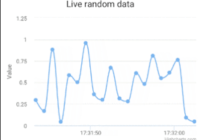
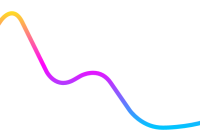
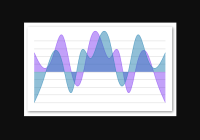
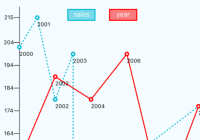
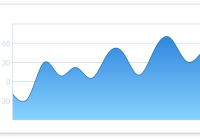
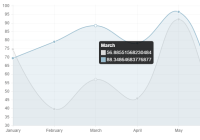
- Line chart
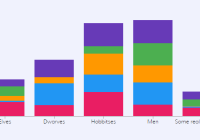
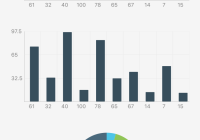
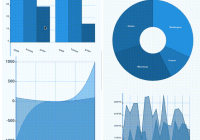
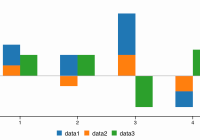
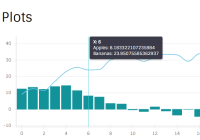
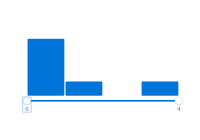
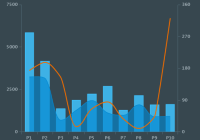
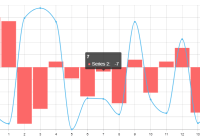
- Bar chart
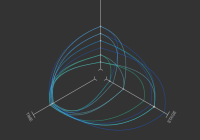
- Radar chart
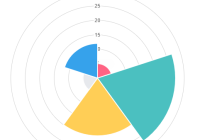
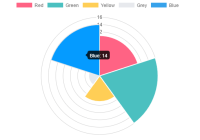
- Polar area chart
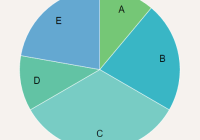
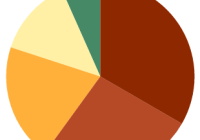
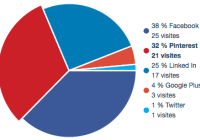
- Pie chart
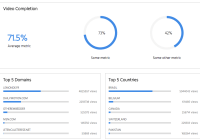
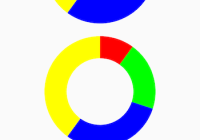
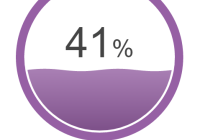
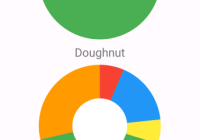
- Doughnut chart
Installation
This is a CommonJS component only (to be used with something like Webpack or Browserify)
npm install --save react-chartjs You must also include chart.js and React as dependencies.
npm install --save chart.js@^1.1.1 react react-dom Example Usage
var LineChart = require("react-chartjs").Line; var MyComponent = React.createClass({ render: function() { return <LineChart data={chartData} options={chartOptions} width="600" height="250"/> } });datarepresents the chart data (see chart.js for details)optionsrepresents the chart options (see chart.js for details)- all other parameters will be passed through to the
canvaselement - if data passed into the component changes, points will animate between values using chart.js'
.update(). If you want the chart destroyed and redrawn on every change, pass inredrawas a prop. For example<LineChart data={this.state.chartData} redraw />
Chart References
The canvas element can be retrieved using getCanvas and the chartjs object can be retrieved using getChart.