React Native Pure Chart


Pure react native chart library that not using svg or ART but only using react-native components.
(You don't have to import drawing library with react-native link or add ART to your project!)
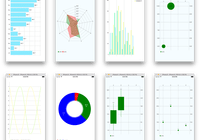
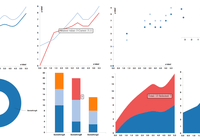
Demo
-
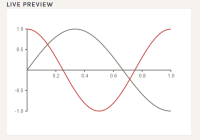
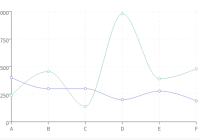
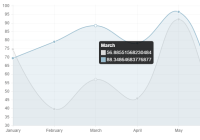
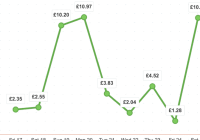
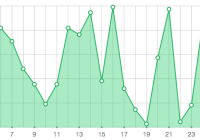
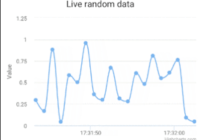
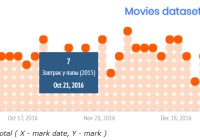
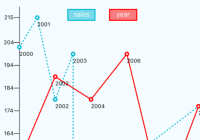
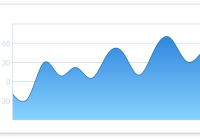
LineChart
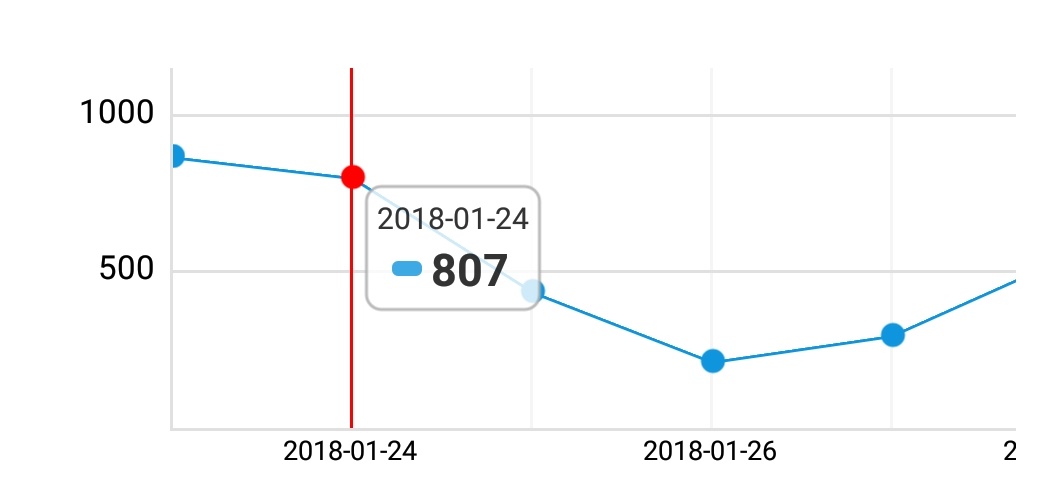
-
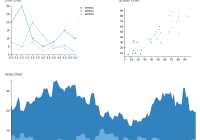
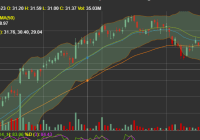
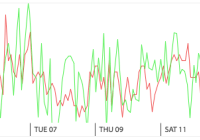
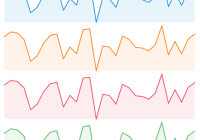
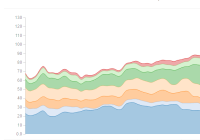
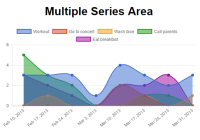
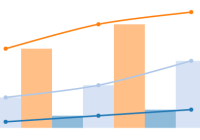
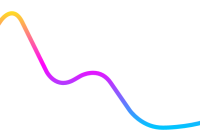
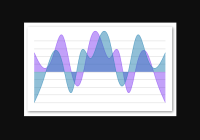
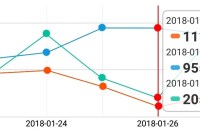
LineChart (Multi series)
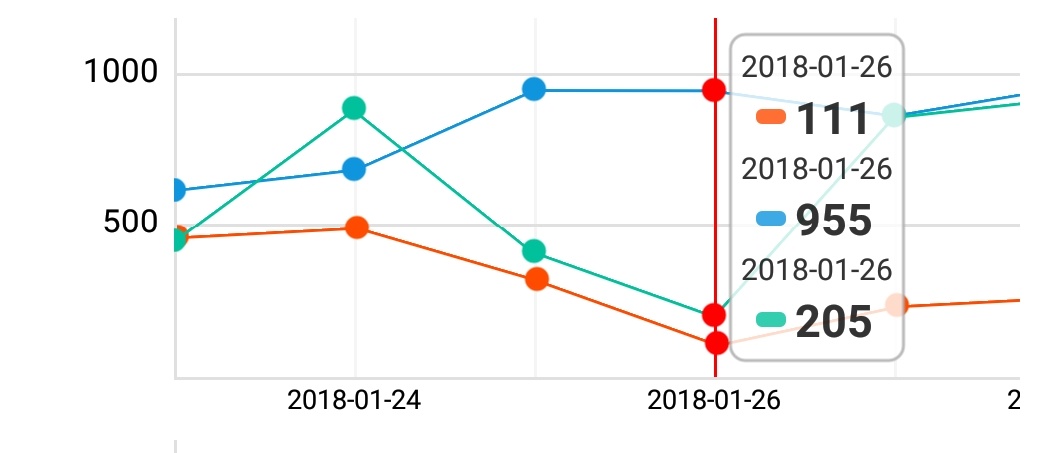
-
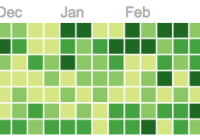
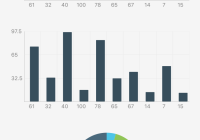
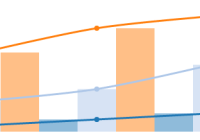
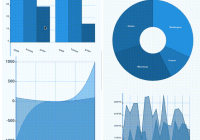
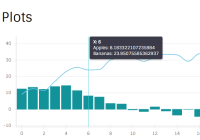
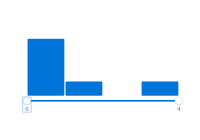
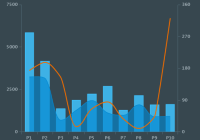
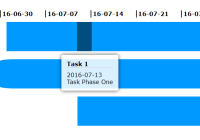
BarChart
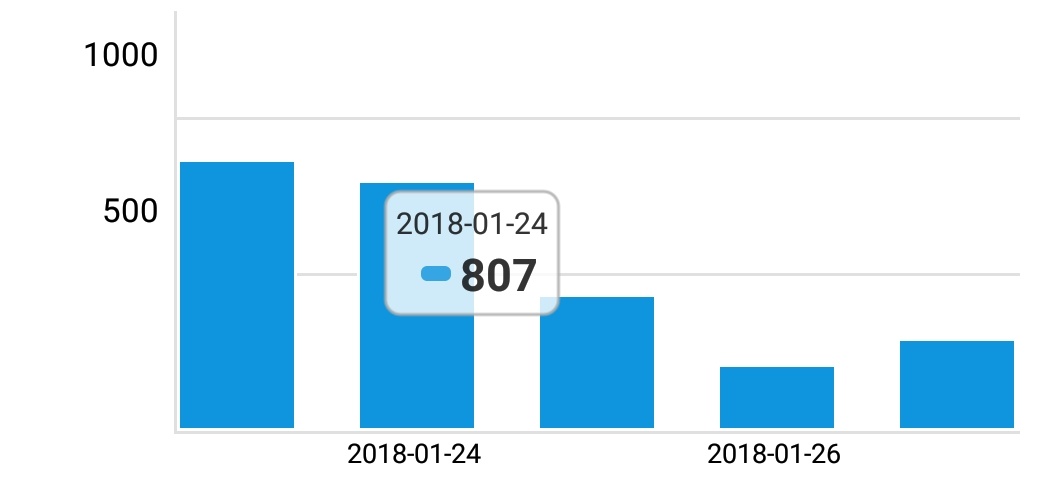
-
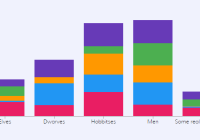
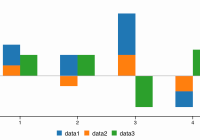
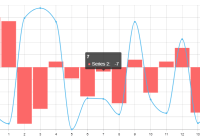
BarChart (Multi series)
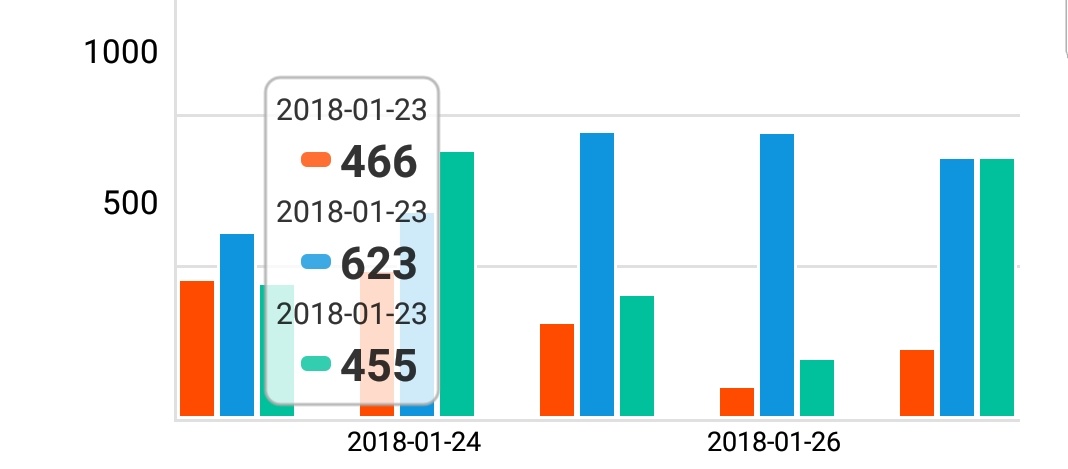
-
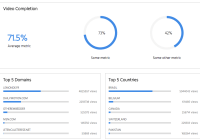
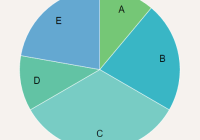
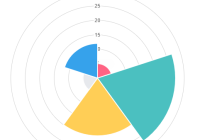
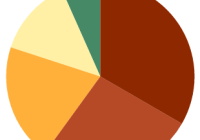
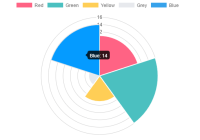
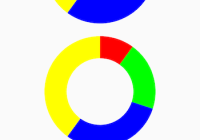
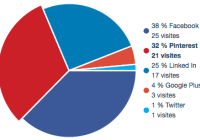
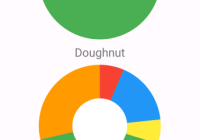
PieChart (Beta)


Installation
yarn add react-native-pure-chartAlternatively with npm:
npm install react-native-pure-chart --saveRequired
import PureChart from 'react-native-pure-chart';Usage
Single Series: Simple
render( ... let sampleData = [30, 200, 170, 250, 10] <PureChart data={sampleData} type='line' /> ... );Single Series: with labels
render( ... let sampleData = [ {x: '2018-01-01', y: 30}, {x: '2018-01-02', y: 200}, {x: '2018-01-03', y: 170}, {x: '2018-01-04', y: 250}, {x: '2018-01-05', y: 10} ] <PureChart data={sampleData} type='line' /> ... );Multi Series: Simple
render( ... let sampleData = [ [ {seriesName: 'series1', data: [30, 200, 170, 250, 10], color: '#297AB1'}, {seriesName: 'series2', data: [20, 100, 150, 130, 15], color: 'yellow'} ] ] <PureChart data={sampleData} type='line' /> ... );Multi Series: with labels
render( ... let sampleData = [ { seriesName: 'series1', data: [ {x: '2018-02-01', y: 30}, {x: '2018-02-02', y: 200}, {x: '2018-02-03', y: 170}, {x: '2018-02-04', y: 250}, {x: '2018-02-05', y: 10} ], color: '#297AB1' }, { seriesName: 'series2', data: [ {x: '2018-02-01', y: 20}, {x: '2018-02-02', y: 100}, {x: '2018-02-03', y: 140}, {x: '2018-02-04', y: 550}, {x: '2018-02-05', y: 40} ], color: 'yellow' } ] <PureChart data={sampleData} type='line' /> ... );Pie chart
render( ... let sampleData = [ { value: 50, label: 'Marketing', color: 'red', }, { value: 40, label: 'Sales', color: 'blue' }, { value: 25, label: 'Support', color: 'green' } ] <PureChart data={sampleData} type='pie' /> ... );Props
type: string
type of chart. ['line' | 'bar' | 'pie'] is now available
height: number
height of chart
data: array
data for chart
var data = [30, 200, 170, 250, 10] var dataWithLabel = [ {x: '2017-10-01', y: 30}, {x: '2017-10-02', y: 200}, {x: '2017-10-03', y: 170} ... ]multi series data for chart
var data = [ {seriesName: 'series1', data: [30, 200, 170, 250, 10], color: '#297AB1'}, {seriesName: 'series2', data: [40, 250, 110, 290, 14], color: 'blue'} ] var dataWithLabel = [ { seriesName: 'series1', data:[ {x: '2017-10-01', y: 30}, {x: '2017-10-02', y: 200}, {x: '2017-10-03', y: 170} ... ], color: '#297AB1' }, .... ]customValueRenderer: func
add custom value on the point
<PureChart type={'line'} data={data} width={'100%'} height={200} customValueRenderer={(index, point) => { if (index % 2 === 0) return null return ( <Text style={{textAlign: 'center'}}>{point.y}</Text> ) }}/>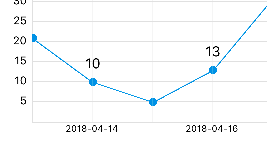
numberOfYAxisGuideLine: number
set number of Y Axis guide line
Contributing
Contributions are welcome. Any kind of contribution, such as writing a documentation, bug fix, or solving issues are helpful.
The master branch of this repository contains the latest stable release of react-native-pure-chart. In general, pull requests should be submitted from a separate branch starting from the develop branch.
License
MIT