 rumble-charts


React components for building composable and flexible charts to visualize your data.
It's based on D3.js under the hood, but most of the time you will not feel that.
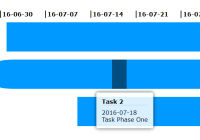
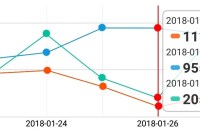
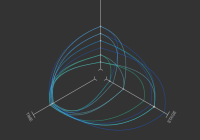
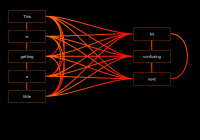
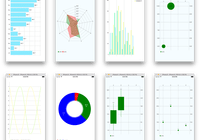
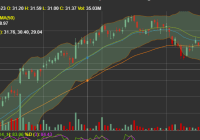
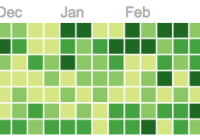
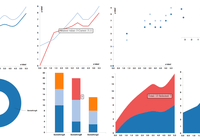
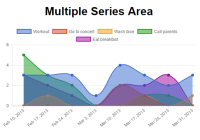
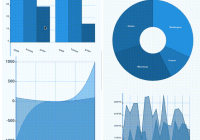
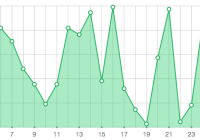
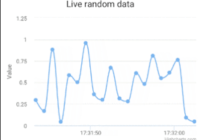
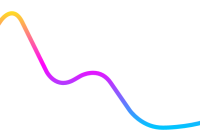
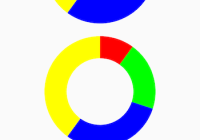
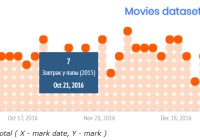
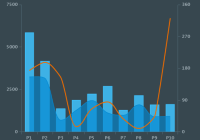
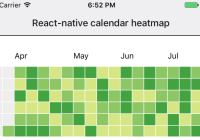
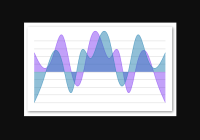
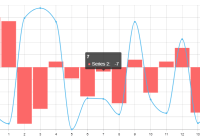
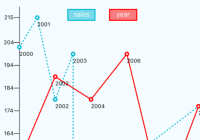
Real-world examples


Documentation
All examples are editable. You can see a result right on the page.
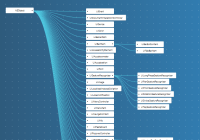
https://rumble-charts.github.io
Demo / live edit
rosko.github.io/slides/2016-04-declarative-charts/#/liveedit
Installation
NPM
npm install --save rumble-chartsUsage
Just include it:
import { // main component Chart, // graphs Bars, Cloud, Dots, Labels, Lines, Pies, RadialLines, Ticks, Title, // wrappers Layer, Animate, Transform, Handlers, // helpers helpers, DropShadow, Gradient } from 'rumble-charts';And use:
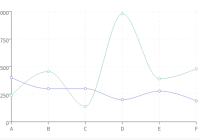
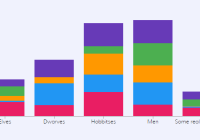
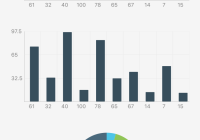
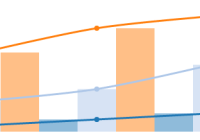
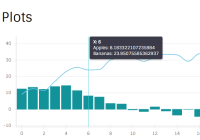
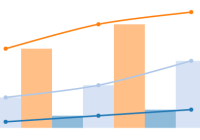
const series = [{ data: [1, 2, 3] }, { data: [5, 7, 11] }, { data: [13, 17, 19] }]; class Demo extends React.Component { render() { return <Chart width={600} height={250} series={series} minY={0} maxY={20}> <Bars innerPadding={5} groupPadding={10} /> <Lines /> <Dots /> </Chart>; } }Result:

Road map
Similar projects
Mainly there are 3 approaches to integrate React and D3:
- React wraps D3
- D3 prepares virtual DOM for React
- d3-react-sparkline - based on react-faux-dom
- react-faux-dom
- React builds virtual DOM, D3 makes math (
rumble-chartsis here)
License
MIT