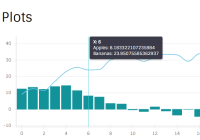
React Charts


Simple, immersive and interactive charts for React
Features
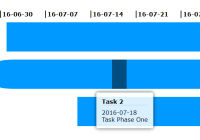
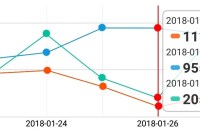
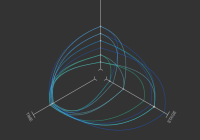
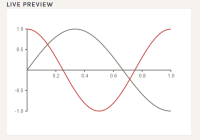
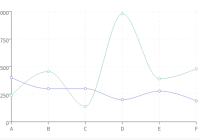
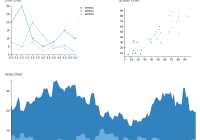
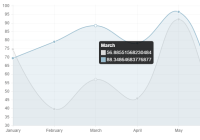
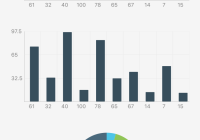
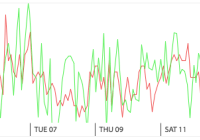
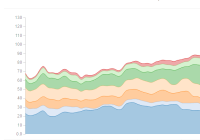
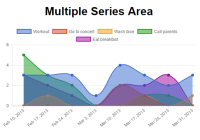
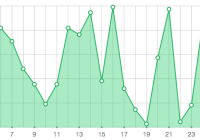
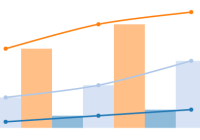
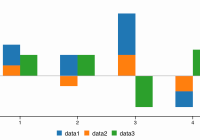
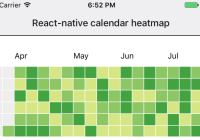
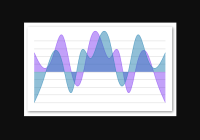
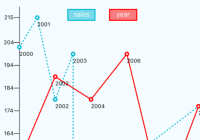
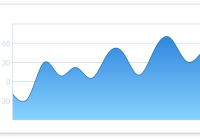
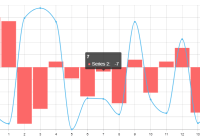
- Line, Bar, Bubble, Area.
- Hyper Responsive
- Powered by D3
- React Hooks Ready
- Flexible data model
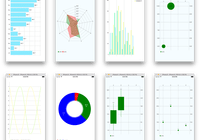
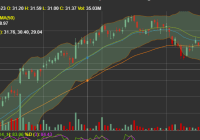
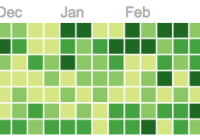
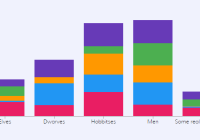
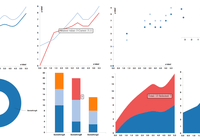
Demos
Intro
React Charts is currently in beta! This means:
- The existing API is mostly stable. Expect only subtle changes/additions as use-cases become polished.
- It's safe for most production sites, as long as you lock in the alpha version.
Table of Contents
Installation
$ yarn add react-charts # or $ npm i react-charts --saveQuick Start
React
This will render a very basic line chart:
import React from 'react' import { Chart } from 'react-charts' function MyChart() { const data = React.useMemo( () => [ { label: 'Series 1', data: [[0, 1], [1, 2], [2, 4], [3, 2], [4, 7]] }, { label: 'Series 2', data: [[0, 3], [1, 1], [2, 5], [3, 6], [4, 4]] } ], [] ) const axes = React.useMemo( () => [ { primary: true, type: 'linear', position: 'bottom' }, { type: 'linear', position: 'left' } ], [] ) const lineChart = ( // A react-chart hyper-responsively and continuusly fills the available // space of its parent element automatically <div style={{ width: '400px', height: '300px' }} > <Chart data={data} axes={axes} /> </div> ) }Documentation
Complete documentation is coming soon. The most detailed usage examples are visible by browsing the website's examples.
Any sparse documentation available in this Readme is being progressively improved as the API evolves.
API
React Charts exposes these top-level exports:
Chart- The Chart component used to render charts- Series Type Components
LineBarBubbleArea
- Curve Functions
curveBasisClosedcurveBasisOpencurveBasiscurveBundlecurveCardinalClosedcurveCardinalOpencurveCardinalcurveCatmullRomClosedcurveCatmullRomOpencurveCatmullRomcurveLinearClosedcurveLinearcurveMonotoneXcurveMonotoneYcurveNaturalcurveStepcurveStepAftercurveStepBefore
- Position Constants
positionToppositionRightpositionBottompositionLeft
- Grouping Constants
groupingSinglegroupingSeriesgroupingPrimarygroupingSecondary
- Tooltip Alignment Constants
alignAutoalignRightalignTopRightalignBottomRightalignLeftalignTopLeftalignBottomLeftalignTopalignBottom
- Axis Type Constants
axisTypeOrdinalaxisTypeTimeaxisTypeUtcaxisTypeLinearaxisTypeLog
- Tooltip Anchor Constants
anchorPointeranchorClosestanchorCenteranchorTopanchorBottomanchorLeftanchorRightanchorGridTopanchorGridBottomanchorGridLeftanchorGridRight
- Focus Mode Constants
focusAutofocusClosestfocusElement
Memoize your Props!
As you'll see in every example, the React Charts <Chart> component expects all props and options to be memoized using either React.useMemo or React.useCallback. While passing an unmemoized option/prop to the <Chart> component won't severly break any visible functionality, your charts will be severly non-performant. Internally, React Charts uses the immutable nature of thes options/props to detect changes to the configuration and update accordingly.
While this may feel heavy at first, it gives you, the dev, full control over when you want to update your charts. To trigger and update, simply trigger one of your React.useMemo or React.useCallback hooks on the part of the config that you would like to update!
Data Model
React Charts uses a common and very flexible data model based on arrays of series and arrays of datums. You can either use the model defaults directly, or use data accessors to materialize this structure.
Typical visualization data can come in practically any shape and size. The following examples show data structures that are all reasonably equivalent at some level since they each contain an array of series[] and datums[]. They also show how to parse that data.
In the following example, there is no need to use any accessors. The default accessors are able to easily understand this format:
function MyChart() { const data = React.useMemo( () => [ { label: 'Series 1', data: [{ x: 1, y: 10 }, { x: 2, y: 10 }, { x: 3, y: 10 }] }, { label: 'Series 2', data: [{ x: 1, y: 10 }, { x: 2, y: 10 }, { x: 3, y: 10 }] }, { label: 'Series 3', data: [{ x: 1, y: 10 }, { x: 2, y: 10 }, { x: 3, y: 10 }] } ], [] ) const axes = React.useMemo( () => [ { primary: true, type: 'linear', position: 'bottom' }, { type: 'linear', position: 'left' } ], [] ) return ( <div style={{ width: '400px', height: '300px' }} > <Chart data={data} axes={axes} /> </div> ) }In the following example, there is no need to use any accessors. The default accessors are able to easily understand this format, but please note that this format limits you from passing any meta data about your series and datums.
function MyChart() { const data = React.useMemo( () => [ [[1, 10], [2, 10], [3, 10]], [[1, 10], [2, 10], [3, 10]], [[1, 10], [2, 10], [3, 10]] ], [] ) const axes = React.useMemo( () => [ { primary: true, type: 'linear', position: 'bottom' }, { type: 'linear', position: 'left' } ], [] ) return ( <div style={{ width: '400px', height: '300px' }} > <Chart data={data} axes={axes} /> </div> ) }Data Accessors
When data isn't in a convenient format for React Charts, your first instinct will be to transform your data into the above formats. Don't do that! There is an easier way Chart components' accessor props to point things in the right direction. Accessor props pass the original data and the series/datums you return down the line to form a new data model. See the <Chart> component for all available accessors.
In the following example, the data is in a very funky format, but at it's core is the same as the previous examples.
function MyChart() { // Use any data object you want const originalData = React.useMemo( () => ({ axis: [1, 2, 3], lines: [ { data: [{ value: 10 }, { value: 10 }, { value: 10 }] }, { data: [{ value: 10 }, { value: 10 }, { value: 10 }] }, { data: [{ value: 10 }, { value: 10 }, { value: 10 }] } ] }), [] ) // Make data.lines represent the different series const data = React.useMemo(data => originalData.lines, [originalData]) // Use data.lines[n].data to represent the different datums for each series const getDatums = React.useCallback(series => series.data, []) // Use the original data object and the datum index to reference the datum's primary value. const getPrimary = React.useCallback( (datum, i, series, seriesIndex, data) => originalData.axis[i], [] ) // Use data.lines[n].data[n].value as each datums secondary value const getSecondary = React.useCallback(datum => datum.value, []) return ( <div style={{ width: '400px', height: '300px' }} > <Chart data={data} getSeries={getSeries} getDatums={getDatums} getPrimary={getPrimary} getSecondary={getSecondary} /> </div> ) }Series Labels
Multiple series are often useless without labels. By default, React Charts looks for the label value on the series object you pass it. If not found, it will simply label your series as Series [n], where [n] is the zero-based index of the series, plus 1.
If the default label accessor doesn't suit your needs, then you can use the <Chart> component's getLabel accessor prop:
function MyChart() { const data = React.useMemo( () => [ { specialLabel: 'Hello World!', data: [ //... ] } ], [] ) const getLabel = React.useCallback(series => series.specialLabel, []) return ( <div style={{ width: '400px', height: '300px' }} > <Chart data={data} getLabel={getLabel} /> </div> ) }Axes & Scales
React Charts supports an axes prop that handles both the underlying scale and visual rendering. These axes can be combined and configured to plot data in many ways. To date, we have the following scale types available:
- Cartesian
linear- A continuous axis used for plotting numerical data on an evenly distributed scale. Works well both as a primary and secondary axis.ordinal- A banded axis commonly used to plot categories or ordinal information. Works well as the primary axis for bar charts.time- A continuous axis used for plotting localized times and dates on an evenly distributed scale. Works well as a primary axis.utc- Similar to thetimescale, but supports UTC datetimes instead of localized datetimes. Works well as a primary axis.log- A continuous axis used for plotting numerical data on a logarithmically distributed scale. Works well as a secondary axis