React Chartkick
Create beautiful JavaScript charts with one line of React
Supports Chart.js, Google Charts, and Highcharts
Quick Start
Run
yarn add react-chartkick chart.jsAnd add
import { LineChart, PieChart } from 'react-chartkick' import 'chart.js'This sets up Chartkick with Chart.js. For other charting libraries, see detailed instructions.
Charts
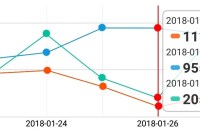
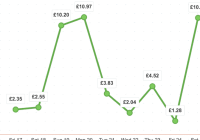
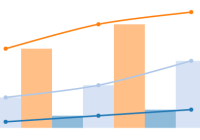
Line chart
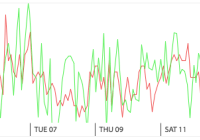
<LineChart data={{"2017-01-01": 11, "2017-01-02": 6}} />Pie chart
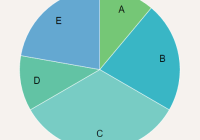
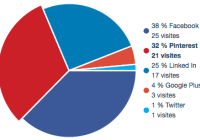
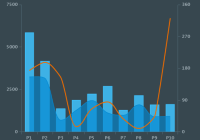
<PieChart data={[["Blueberry", 44], ["Strawberry", 23]]} />Column chart
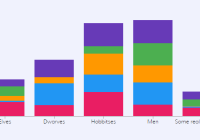
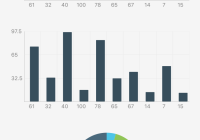
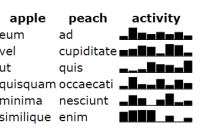
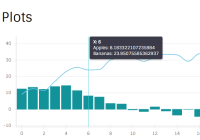
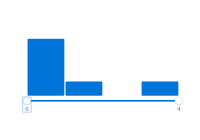
<ColumnChart data={[["Sun", 32], ["Mon", 46], ["Tue", 28]]} />Bar chart
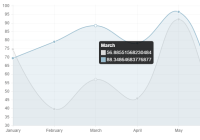
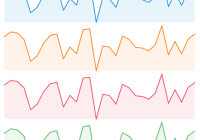
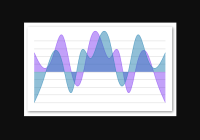
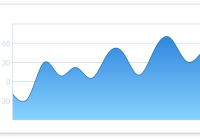
<BarChart data={[["Work", 32], ["Play", 1492]]} />Area chart
<AreaChart data={{"2017-01-01": 11, "2017-01-02": 6}} />Scatter chart
<ScatterChart data={[[174.0, 80.0], [176.5, 82.3]]} xtitle="Size" ytitle="Population" />Geo chart - Google Charts
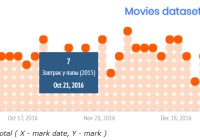
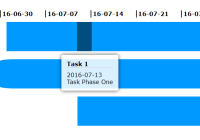
<GeoChart data={[["United States", 44], ["Germany", 23], ["Brazil", 22]]} />Timeline - Google Charts
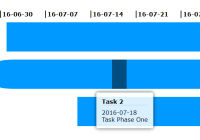
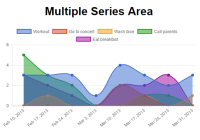
<Timeline data={[["Washington", "1789-04-29", "1797-03-03"], ["Adams", "1797-03-03", "1801-03-03"]]} />Multiple series
data = [ {"name":"Workout", "data": {"2017-01-01": 3, "2017-01-02": 4}}, {"name":"Call parents", "data": {"2017-01-01": 5, "2017-01-02": 3}} ]; // and <LineChart data={data} />Say Goodbye To Timeouts
Make your pages load super fast and stop worrying about timeouts. Give each chart its own endpoint.
<LineChart data="/stocks" />Options
Id, width, and height
<LineChart id="users-chart" width="800px" height="500px" />Min and max values
<LineChart min={1000} max={5000} />min defaults to 0 for charts with non-negative values. Use null to let the charting library decide.
Min and max for x-axis - Chart.js
<LineChart xmin="2018-01-01" xmax="2019-01-01" />Colors
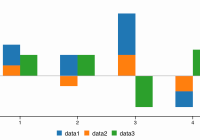
<LineChart colors={["#b00", "#666"]} />Stacked columns or bars
<ColumnChart stacked={true} />Discrete axis
<LineChart discrete={true} />Label (for single series)
<LineChart label="Value" />Axis titles
<LineChart xtitle="Time" ytitle="Population" />Straight lines between points instead of a curve
<LineChart curve={false} />Show or hide legend
<LineChart legend={true} />Specify legend position
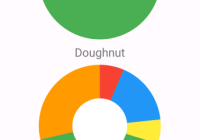
<LineChart legend="bottom" />Donut chart
<PieChart donut={true} />Prefix, useful for currency - Chart.js, Highcharts
<LineChart prefix="$" />Suffix, useful for percentages - Chart.js, Highcharts
<LineChart suffix="%" />Set a thousands separator - Chart.js, Highcharts
<LineChart thousands="," />Set a decimal separator - Chart.js, Highcharts
<LineChart decimal="," />Show a message when data is empty
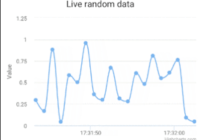
<LineChart messages={{empty: "No data"}} />Refresh data from a remote source every n seconds
<LineChart refresh={60} />You can pass options directly to the charting library with:
<LineChart library={{backgroundColor: "#eee"}} />See the documentation for Google Charts, Highcharts, and Chart.js for more info.
To customize datasets in Chart.js, use:
<LineChart dataset={{borderWidth: 10}} />You can pass this option to individual series as well.
Global Options
To set options for all of your charts, use:
Chartkick.options = { colors: ["#b00", "#666"] }Data
Pass data as an array or object
<PieChart data={{"Blueberry": 44, "Strawberry": 23}} /> <PieChart data={[["Blueberry", 44], ["Strawberry", 23]]} />Times can be a Date or a string (strings are parsed)
<LineChart data={[[new Date(), 5], ["2017-01-01 00:00:00 UTC", 7]]} />Multiple Series
You can pass a few options with a series:
namedatacolordataset- Chart.js onlypoints- Chart.js onlycurve- Chart.js only
Download Charts
Chart.js only
Give users the ability to download charts. It all happens in the browser - no server-side code needed.
<LineChart download={true} />Set the filename
<LineChart download="boom" />Note: Safari will open the image in a new window instead of downloading.
Set the background color
<LineChart download={{background: "#fff"}} />Installation
Chart.js
Run
yarn add react-chartkick chart.jsAnd add
import { LineChart, PieChart } from 'react-chartkick' import 'chart.js'Google Charts
Run
yarn add react-chartkickAnd add
import Chartkick, { LineChart, PieChart } from 'react-chartkick'And include on the page
<script src="https://www.gstatic.com/charts/loader.js"></script>To specify a language or Google Maps API key, use:
Chartkick.configure({language: "de", mapsApiKey: "..."})Highcharts
Run
yarn add react-chartkick highchartsAnd add
import Chartkick, { LineChart, PieChart } from 'react-chartkick' import Highcharts from 'highcharts' Chartkick.use(Highcharts)No Package Manager
Include the charting library and the Chartkick library
<script src="https://unpkg.com/[email protected]/dist/Chart.bundle.js"></script> <script src="https://unpkg.com/[email protected]"></script>Charts are prefixed with ReactChartkick, like ReactChartkick.LineChart.
Multiple Libraries
If more than one charting library is loaded, choose between them with:
<LineChart adapter="google" />Options are google, highcharts, and chartjs
Contributing
Everyone is encouraged to help improve this project. Here are a few ways you can help:
- Report bugs
- Fix bugs and submit pull requests
- Write, clarify, or fix documentation
- Suggest or add new features
To get started with development, run:
git clone https://github.com/ankane/react-chartkick.git cd react-chartkick yarn yarn build