RxJS Diagrams
React Components for visualising RxJS observables and operators


RxJS Diagrams provides React Components for interactively visualising RxJS observables and operators. It is a rewrite (and redesign) of the amazing RxMarbles. The goal is to provide simple and reusable components for quickly explaining how RxJS works.
npm install --save rxjs-diagramsDon't forget to install its peer dependencies, react and rxjs.
Usage
One input stream
This renders an SVG showing the input values and the result. The input values are converted to an observables and then transformed to an output using the transform prop.
import 'rxjs' // This imports all observables, operators, etc import OperatorDiagram from 'rxjs-diagrams' // Somewhere in your components... <OperatorDiagram label=".distinctUntilChanged()" transform={obs => obs.distinctUntilChanged()} emissions={[ { x: 5, d: 1 }, { x: 35, d: 1 }, { x: 70, d: 3 } ]} end={80} completion={80} />Two input streams
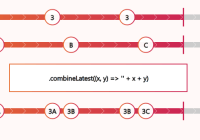
Having multiple input streams is as simple as passing multiple value arrays and accepting them in your transform function.
import { Observable } from 'rxjs' import OperatorDiagram from 'rxjs-diagrams' // Somewhere in your components... <OperatorDiagram label=".combineLatest((x, y) => '' + x + y)" transform={(a, b) => Observable.combineLatest(a, b, (x, y) => '' + x + y)} emissions={[ [ { x: 5, d: 1 }, { x: 35, d: 2 }, { x: 70, d: 3 } ], [ { x: 10, d: 'A' }, { x: 45, d: 'B' }, { x: 80, d: 'C' } ] ]} end={80} completion={80} />API
Exports:
- transformEmissions
- EmissionsView (Docs TODO)
- TransitionEmissionsView (Docs TODO)
- DraggableEmissionsView (Docs TODO)
- ChainDiagram (Docs TODO)
- OperatorDiagram (also the default export)
Emissions, End & Completion
The common three values that describe your input are: emissions, end, and completion. This is enough for this library to generate an input observable.
Emissions are an array of objects, which have a time value x and a label d. The value x must be a number. (Example: { x: 5, d: 'A' })
Completion is the time value when your observable completes. It is a number and usually you'll want it to be larger than all x values of your emissions.
End is where the component stops to draw your observable. It basically defines how long in time the diagram is. So if your end is 20 and an emission's x is 10, then the emission will be drawn right in the center.
OperatorDiagram
Props
-
label?: string: Some text that describes your transformation. -
transform: (...input, scheduler): A function that transforms the input observables and produces an output. It receives the input observables as the first arguments and the scheduler last. You will need the scheduler to transform the virtual observable's time. For example fordelay. More information on Schedulers here -
emissions: Emission[] | Emission[][]: Here you can pass an array of emissions (described above) or an array of an array of emissions, in case you want multiple input observables. -
end: number: Described above. -
completion: number: Described above. -
width: number: The width of the resulting SVG. -
height: number: The height of the resulting SVG component.