React Google Charts


A thin, typed, React wrapper for Google Charts.
Docs and examples.
- React Google Charts
- Docs and examples.
- Installation
- Quick Start
- Quick Walkthrough
- Examples
- Load Data
- Charts
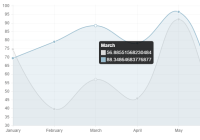
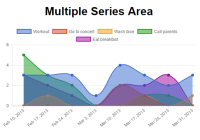
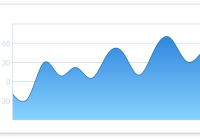
- Area Chart
- Bar Chart
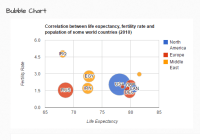
- Bubble Chart
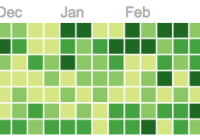
- Calendar Chart
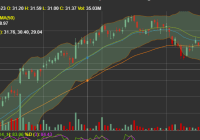
- Candlestick Chart
- Column Chart
- Diff Scatter Chart
- Diff Column Chart
- Donut Chart
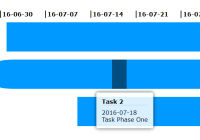
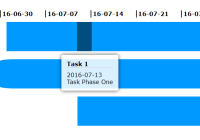
- Gantt Chart
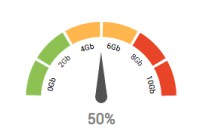
- Gauge Chart
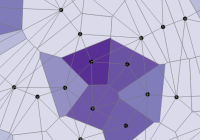
- Geo Chart
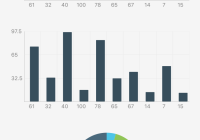
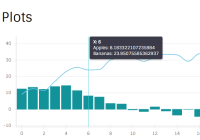
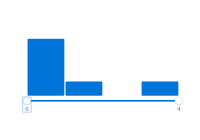
- Histogram Chart
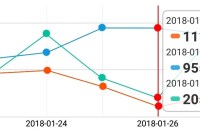
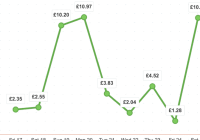
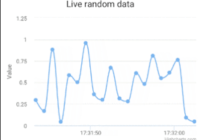
- Line Chart
- Material Bar Chart
- Material Line Chart
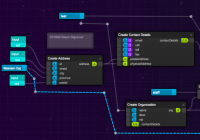
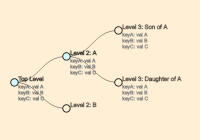
- Org Chart
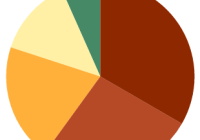
- Pie Chart
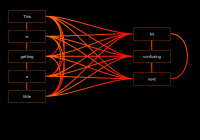
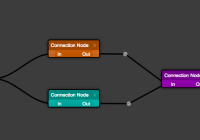
- Sankey Chart
- Scatter Chart
- Stepped Area Chart
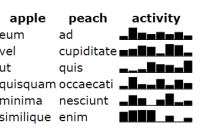
- Table Chart
- Timeline Chart
- Treemap Chart
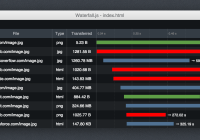
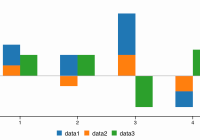
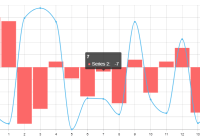
- Waterfall Chart
- Wordtree Chart
- Run the example app
- Contributing
Installation
With your favorite package manager (yarn, pnpm or npm) :
yarn add react-google-charts # or npm i -s react-google-chartsNote : If you're using react < 16.3 then use 2.x version:
yarn add react-google-charts@2Quick Start
import * as React from "react"; import { render } from "react-dom"; import { Chart } from "react-google-charts"; export default class App extends React.Component { render() { return ( <div className={"my-pretty-chart-container"}> <Chart chartType="ScatterChart" data={[["Age", "Weight"], [4, 5.5], [8, 12]]} width="100%" height="400px" legendToggle /> </div> ); } } render(<App />, document.querySelector("#app"));Quick Walkthrough
Initialize from data array
import { Chart } from "react-google-charts"; import * as React from "react"; import { render } from "react-dom"; const options = { title: "Age vs. Weight comparison", hAxis: { title: "Age", viewWindow: { min: 0, max: 15 } }, vAxis: { title: "Weight", viewWindow: { min: 0, max: 15 } }, legend: "none" }; const data = [ ["Age", "Weight"], [8, 12], [4, 5.5], [11, 14], [4, 5], [3, 3.5], [6.5, 7] ]; const ExampleChart = () => { return ( <Chart chartType="ScatterChart" data={data} options={options} width="80%" height="400px" legendToggle /> ); }; render(<ExampleChart />, document.getElementByID("app"));Initialize using rows and columns
import * as React from "react"; import { Chart } from "react-google-charts"; const ExampleChart = () => { return ( <Chart chartType="ScatterChart" rows={[[8, 12], [4, 5.5], [11, 14], [4, 5], [3, 3.5], [6.5, 7]]} columns={[ { type: "number", label: "Age" }, { type: "number", label: "Weight" } ]} options={ // Chart options { title: "Age vs. Weight comparison", hAxis: { title: "Age", viewWindow: { min: 0, max: 15 } }, vAxis: { title: "Weight", viewWindow: { min: 0, max: 15 } }, legend: "none" } } width={"100%"} height={"400px"} legendToggle /> ); }; export default ExampleChart;Listen to chart events
Set the chart-specific events you want to listen to and the corresponding callback. The callback has the component as an argument.
import * as React from "react"; import { Chart } from "react-google-charts"; const chartEvents = [ { eventName: "select", callback({ chartWrapper }) { console.log("Selected ", chartWrapper.getChart().getSelection()); } } ]; const data = [ ["age", "weight"], [8, 12], [4, 5.5], [11, 14], [4, 5], [3, 3.5], [6.5, 7] ]; const options = { title: "Age vs. Weight comparison", hAxis: { title: "Age", viewWindow: { min: 0, max: 15 } }, vAxis: { title: "Weight", viewWindow: { min: 0, max: 15 } }, legend: "none" }; const ExampleChart = () => { return ( <Chart chartType="ScatterChart" data={data} options={options} graphID="ScatterChart" width="100%" height="400px" chartEvents={chartEvents} /> ); }; export default ExampleChart;Examples
Load Data
Load Data From SpreadSheet
Charts
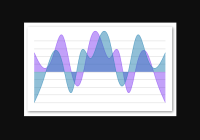
Area Chart
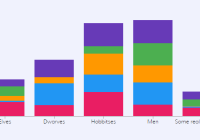
Bar Chart
Bubble Chart
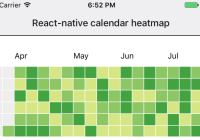
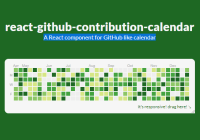
Calendar Chart
Candlestick Chart
Column Chart
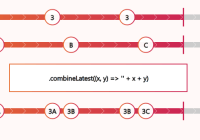
Diff Scatter Chart
Diff Column Chart
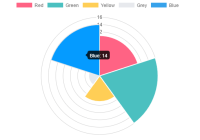
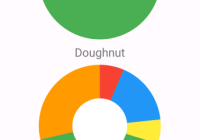
Donut Chart
Gantt Chart
Gauge Chart
Geo Chart
Histogram Chart
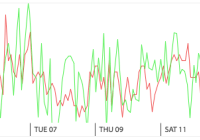
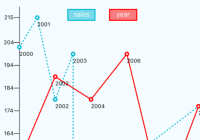
Line Chart
Material Bar Chart
Material Line Chart
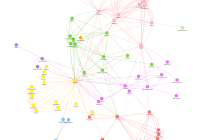
Org Chart
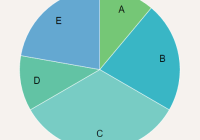
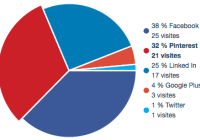
Pie Chart
Sankey Chart
Scatter Chart
Stepped Area Chart
Table Chart
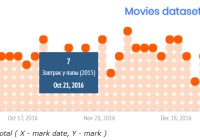
Timeline Chart
Treemap Chart
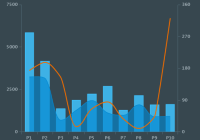
Waterfall Chart
Wordtree Chart
Run the example app
git clone https://www.github.com/rakannimer/react-google-charts cd react-google-charts npm i npm startContributing
Contributions are very welcome. Check out CONTRIBUTING.md