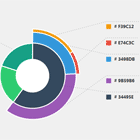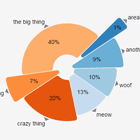
n3-charts.pie-chart 

Yummy pies and donuts for AngularJS applications. Built on top of the wonderful D3.js library.
Here is a demo page.
How to install
- Copy
pie-chart.min.jswherever you want - Reference it in your index.html file
- Reference the module in your app file : angular.module('myApp', [ 'n3-pie-chart' ])
How to use
A pie chart is called using this syntax :
<pie-chart data="data" options="options"></pie-chart>The pie chart directives needs two attributes : data and options. If one is missing, nothing happens.
Data
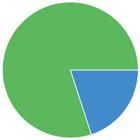
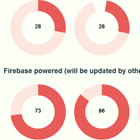
Your data must be an array. Depending whether you wan a pie/donut or a gauge, the array can contain at least two rows, or only one.
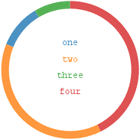
Standard
$scope.data = [ {label: "one", value: 12.2, color: "red"}, {label: "two", value: 45, color: "#00ff00"}, {label: "three", value: 10, color: "rgb(0, 0, 255)"} ];Gauge
$scope.gauge_data = [ {label: "CPU", value: 75, suffix: "%", color: "steelblue"} ];complementBrightness: optional (disabled by default). Expects a number between 0 and 100. If set, it will take the color of the chart, increase the brightness by a given percentage and use the new color for the complement.colorComplement: optional (default is "white"). Defines the color of the complement. Will be ignored ifcomplementBrightnessis set.
Options
Options must be an object. Depending whether you want a pie/donut or a gauge, additional settings can be required.
Standard
$scope.options = {thickness: 10};thickness: optional (default is 10). Defines the chart's thickness and has an impact on the legend display (thicker chart means less space for legend).
Gauge
$scope.gauge_options = {thickness: 5, mode: "gauge", total: 100};thickness: optional (default is 10). Defines the chart's thickness and has an impact on the legend display (thicker chart means less space for legend).mode: optional (default is ""). Can be "gauge" or anything else (but anything else will default to standard pie/donut mode). "gauge" only works when there is exactly one data row in the chart'sdataattribute.total: optional (default is 100). Ignored ifmodeis not "gauge". Make the chart able to display the data relatively to a maximum (for instance, if you want to display a percentage, the maximum should be 100).
Building
Fetch the repo :
$ git clone https://github.com/angular-d3/pie-chart.gitInstall stuff :
$ npm installInstall moar stuff :
$ bower installInstall teh uterz stuff :
$ gruntHack.
Testing
AngularJS is designed to be testable, and so is this project. It has a good coverage rate (between 85% and 95%), and we want to keep it this way.