Google Chart Tools Directive Module
for AngularJS
Install
Install with bower
bower install angular-google-chart --save
Goal
Wrapper directive for Google Chart Tools
Contributing
Interested in contributing to Angular Google Chart? Cool! Check out CONTRIBUTING.md for a brief guide to raising issues and submitting Pull Requests.
A note on branches
Development branch is development.
Release branch is master (idealy), and was created just because Bower needed it.
There is documentation on the gh-pages branch which hosts the project's documentation website.
Please send your pull requests to development.
Building with Grunt
In order to build the project you will need to have NodeJS and NPM installed. In commandline, from the root of the project, run npm install. This will install grunt and the required plugins. Run grunt or grunt build to build ng-google-chart.js and ng-google-chart.min.js with included source maps. grunt release builds without source maps.
Running Tests
Tests are run during build. Use grunt watch to run jshint and tests whenever source files are changed.
Usage and Demo
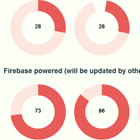
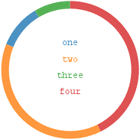
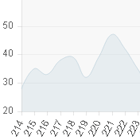
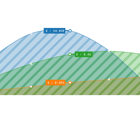
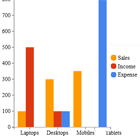
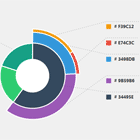
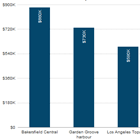
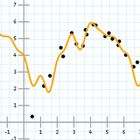
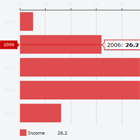
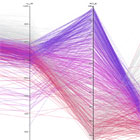
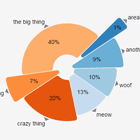
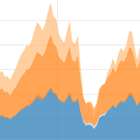
See examples in the Documentation
Other samples
Chart Data doc
See ChartWrapper and DataTable documentation.
Release notes
See CHANGELOG.md for a summary of changes.
Out of luck ?
Try another AngularJS directive that use Highcharts.
