This project is deprecated.
##Features
- One click chart change
- Tiny - 4.4kb minified and gzipped
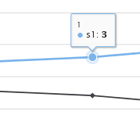
- Auto tooltips
- Auto h,w dimensions updates automatically when resizing
- Beautiful animations
- Callback events
- Simple data format
Download | Playground | Contribute
##Installation Grab the latest zip from releases, copy angular-charts.min.js to web root, and refer it from page.
<script src='path/to/js/angular-charts.min.js' type='text/javascript'></script>Add as dependency in your module
angular.module('yourApp', ['angularCharts']);Dependencies
- angular
- d3
Install using bower
bower install angular-chartsRefer all dependencies in your page in right order
<script src='./bower_components/angular/angular.min.js' type='text/javascript'></script> <script src='./bower_components/d3/d3.min.js' type='text/javascript'></script> <script src='./bower_components/angular-charts/dist/angular-charts.min.js' type='text/javascript'></script>##Configuration Directive syntax
<div ac-chart="chartType" ac-data="data" ac-config="config" id='chart' class='chart'></div>Note: chartType, data and config are properties of scope. Not the actual values.
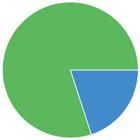
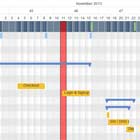
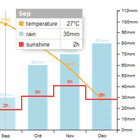
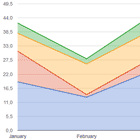
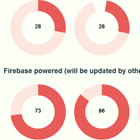
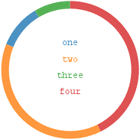
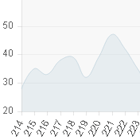
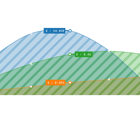
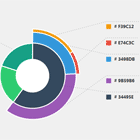
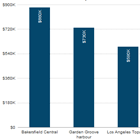
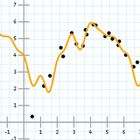
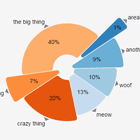
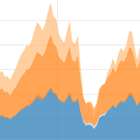
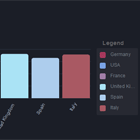
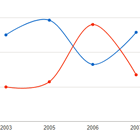
###ac-chart - string Allowed values - 'pie', 'bar', 'line', 'point', 'area'
###ac-config - object
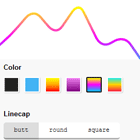
var config = { title: '', // chart title. If this is false, no title element will be created. tooltips: true, labels: false, // labels on data points // exposed events mouseover: function() {}, mouseout: function() {}, click: function() {}, // legend config legend: { display: true, // can be either 'left' or 'right'. position: 'left', // you can have html in series name htmlEnabled: false }, // override this array if you're not happy with default colors colors: [], innerRadius: 0, // Only on pie Charts lineLegend: 'lineEnd', // Only on line Charts lineCurveType: 'cardinal', // change this as per d3 guidelines to avoid smoothline isAnimate: true, // run animations while rendering chart yAxisTickFormat: 's', //refer tickFormats in d3 to edit this value xAxisMaxTicks: 7, // Optional: maximum number of X axis ticks to show if data points exceed this number yAxisTickFormat: 's', // refer tickFormats in d3 to edit this value waitForHeightAndWidth: false // if true, it will not throw an error when the height or width are not defined (e.g. while creating a modal form), and it will be keep watching for valid height and width values };###ac-data - object
Entire data structure looks like this
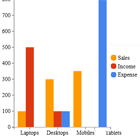
var acData = { series: ["Sales", "Income", "Expense"], data: [{ x: "Computers", y: [54, 0, 879], tooltip: "This is a tooltip" }] }series - string array
var series = [ "Sales", "Income", "Expense" ]data - object array
x defines what goes on x axis, must be a string, y defines what goes on y axis, must be an array of numbers. Values are mapped to series by index. y[0] belongs to series[0], y[1] belongs to series[1] and so on. Tooltip is optional.
Each data point looks like this
var dataPoint = { x: "Computers", y: [54, 0, 879], tooltip: "This is a tooltip" }Note: series and data are arrays
##Events Three events are exposed via config object.
click : function(d) { $scope.messages.push('clicked!'); }, mouseover : function(d) { $scope.messages.push('mouseover!'); }, mouseout : function(d) { $scope.messages.push('mouseout!'); }Contribute
Thanks to all awesome contributors
Some things to follow
- Make sure all tests are passing.
- Update this README if you are doing any change to config object.
- Avoid any changes in data format
- Keep backwards compatibility
Note: Please don't send any PRs until you see this. I'm refactoring angular-charts.
git clone [email protected]:chinmaymk/angular-charts.git npm install bower install grunt To run tests:
grunt karma ##Got suggestions ? Feel free to submit a pull request, file an issue, or get in touch on twitter @_chinmaymk
License - MIT.