angular-flow-chart
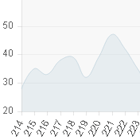
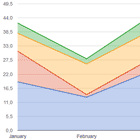
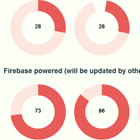
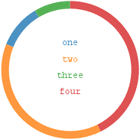
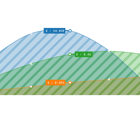
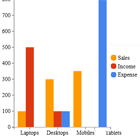
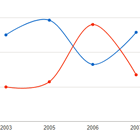
Real-time charts for IoT using angular and flowthings.io. Uses the official flowthings angular client for communication with flowthings.io server.
Install via Bower
bower install angular-flow-chart --saveInclude the scripts
<script src="bower_components/Chart.js/Chart.js"></script> <!-- Chart.js --> <script src="bower_components/angular-chart.js/dist/angular-chart.min.js"></script> <!-- Angular Chart.js --> <script src="bower_components/flowthings-browser/dist/flowthings-browser.min.js"></script> <!-- FlowThings Browser --> <script src="bower_components/flowthings-angular/dist/flowthings-angular.min.js"></script> <!-- FlowThings Angular --> <script src="bower_components/angular-flow-chart/dist/angular-flow-chart.min.js"></script> <!-- Angular Flow Charts -->Include the ngFlowChart module as a dependency to your module, alongside flowthings for the official flowthings.io library:
angular.module('app', ['flowthings', 'ngFlowChart'])Configure and start flowthings service (as per official docs):
angular.module('app') .config(function (flowthingsProvider) { flowthingsProvider.options.account = '< your username >'; flowthingsProvider.options.token = '< your token >'; }) .run(function(flowthings) { flowthings.ws.connect() });Use the <flow-chart></flow-chart> tag in your view, adding a chart plugin within:
<flow-chart flow-id="'f123...'" limit="20"> <flow-chart-js value-properties="['temperature', 'humidity']" chart-type="line"></flow-chart-js> </flow-chart>Full example can be found here.
Angular Flow Chart accepts any JS chart library via a plugin. Example of a plugin using ChartJS can be found here.
Flow Chart
flowChart directive serves as a base for communication with flowthings.io server, initializes data and passes any incoming data to the chart. Any actual chart is handled by plugin directives transcluded within the <flow-chart></flow-chart> tag. You can add as many chart plugins as you want.
Options
flowId: id of the source Flowlimit: max number od data points in the graph - used in initial data fetching and passed down to chart plugin
Transclusion Controller
- Exposes
limitin the controller, so it is available to transcluded charts
Events
flowChart:init: fired upon initialisation, initial drops passed to subscribersflowChart:newDrop: fired when new drop arrives, passing it to the subscribers
For more info on how to build chart plugin, refer to Angular Flow ChartJS Plugin.
