🔔 Alert..!! Get 2 Month Free Cloud Hosting With $200 Bonus From Digital Ocean ACTIVATE DEAL

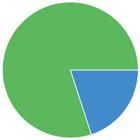
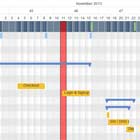
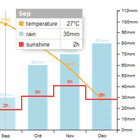
An AngularJS directive for the amCharts library to create JavaScript/HTML5 charts for most of your needs, including serial (column, bar, line, area, step line, step without risers, smoothed line, candlestick and ohlc graphs), pie/donut, radar/polar, y/scatter/bubble, Funnel/Pyramid charts and Angular Gauges.

Chart_Graph Plugins

Documentation

amCharts-Angular

Angular.js directive for amCharts

1. Install from bower

    bower install amcharts-angular --save 

2. Create Angular application

Add script references

// AmCharts Library references <script type="text/javascript" src="lib/amcharts/dist/amcharts/amcharts.js"></script> <script type="text/javascript" src="lib/amcharts/dist/amcharts/serial.js"></script> // amChartsDirective <script type="text/javascript" src="lib/amcharts-angular/dist/amChartsDirective.js"></script>

Inject angular module dependency

angular.module('MyModule', ['amChartsDirective'])

JSFiddle Example here

Promise based JSFiddle Example here

Quick sample code

<am-chart id="myFirstChart" options="amChartOptions" height="100%" width="100%"></am-chart>
$scope.amChartOptions = {         data: [{             year: 2005,             income: 23.5,             expenses: 18.1         }, {             year: 2006,             income: 26.2,             expenses: 22.8         }, {             year: 2007,             income: 30.1,             expenses: 23.9         }, {             year: 2008,             income: 29.5,             expenses: 25.1         }, {             year: 2009,             income: 24.6,             expenses: 25         }],         type: "serial",                  categoryField: "year",         rotate: true,         pathToImages: 'https://cdnjs.cloudflare.com/ajax/libs/amcharts/3.13.0/images/',         legend: {             enabled: true         },         chartScrollbar: {             enabled: true,         },         categoryAxis: {             gridPosition: "start",             parseDates: false         },         valueAxes: [{             position: "top",             title: "Million USD"         }],         graphs: [{             type: "column",             title: "Income",             valueField: "income",             fillAlphas: 1,         }]     }

Promise based chart rendering

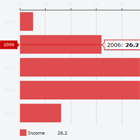
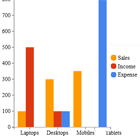
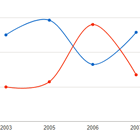
// this function returns our chart data as a promise     $scope.dataFromPromise = function(){     	var deferred = $q.defer();          var data = [{             year: 2005,             income: 23.5,             expenses: 18.1         }, {             year: 2006,             income: 26.2,             expenses: 22.8         }, {             year: 2007,             income: 30.1,             expenses: 23.9         }, {             year: 2008,             income: 29.5,             expenses: 25.1         }, {             year: 2009,             income: 24.6,             expenses: 25         }];          deferred.resolve(data)         return deferred.promise;     };      // We can optionally pass a promise to the options attribute on the AmChartsDirective     // to delay the chart rendering until the promise resolves     $scope.amChartOptions = $timeout(function(){     	return {             // we can also use a promise for the data property to delay the rendering of             // the chart till we actually have data             data: $scope.dataFromPromise(),             type: "serial",             theme: 'black',             categoryField: "year",             rotate: true,             pathToImages: 'https://cdnjs.cloudflare.com/ajax/libs/amcharts/3.13.0/images/',             legend: {                 enabled: true             },             chartScrollbar: {                 enabled: true,             },             categoryAxis: {                 gridPosition: "start",                 parseDates: false             },             valueAxes: [{                 position: "top",                 title: "Million USD"             }],             graphs: [{                 type: "column",                 title: "Income",                 valueField: "income",                 fillAlphas: 1,             }]     	}     }, 1000) 
If you do not specify a category field or a value field, the directive will assume the category field is at index [0] and the value field is at index [1]. Using the example above, 'year' would be the category field, and 'income' would be the value field.

For a list of exposed configuration options, please look at the amCharts API documentation.


You May Also Like