Angular Parallel Coordinates
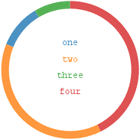
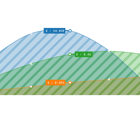
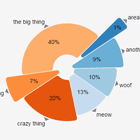
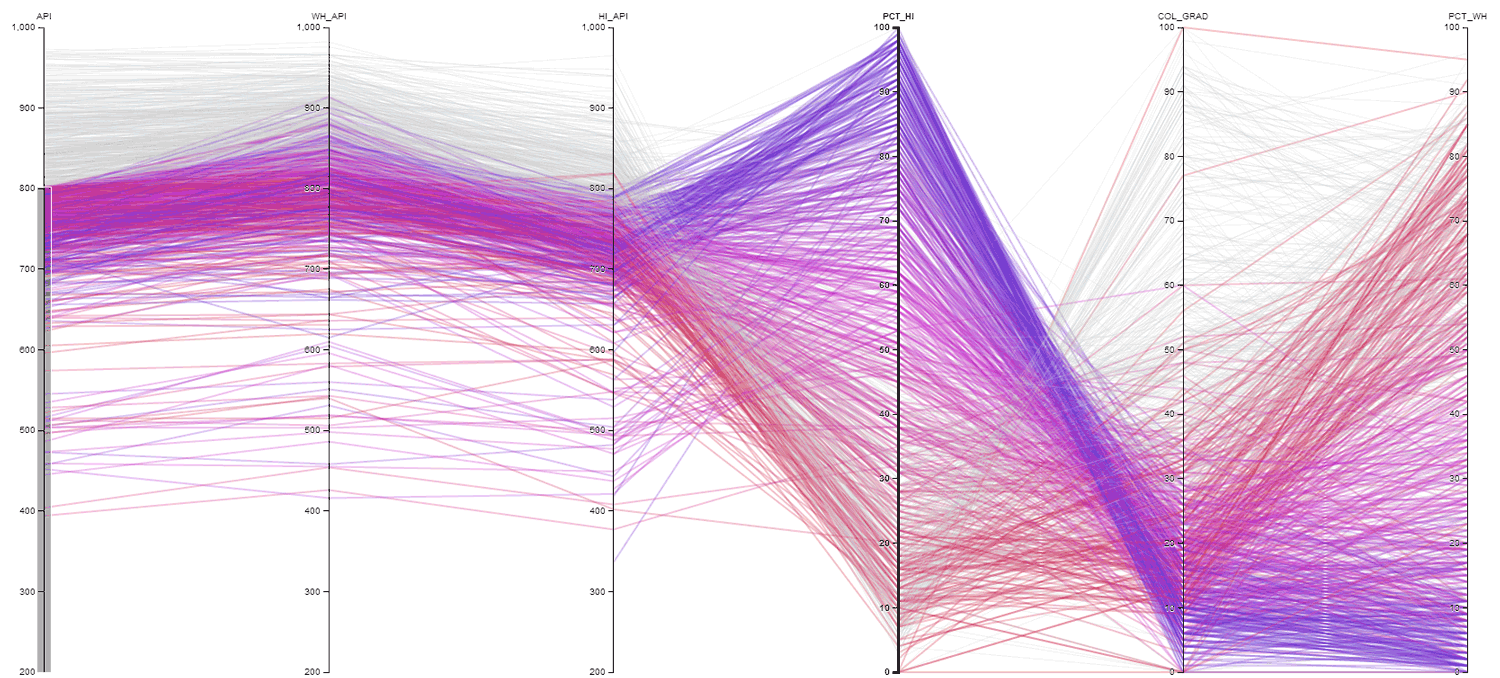
Parallel coordinates are useful for visualizing multivariate data. This is an Angular directive wrapper around parallel-coordinates-chart to allow for easy creation of charts which look like this:
Example
<script src="http://d3js.org/d3.v3.min.js" charset="utf-8"></script> <script src="https://ajax.googleapis.com/ajax/libs/angularjs/1.2.16/angular.min.js"></script> <link type="text/css" rel="stylesheet" href="dist/angular-parallel-coordinates.css" /> <script src="dist/angular-parallel-coordinates.js"></script> <parallel-coordinates-chart width="{{width}}" height="{{height}}" highlight="{{highlight}}" filters="dimensions" data="data" config="config" /> <script> angular.module('example', ['parallelCoordinatesChart']) .controller('example', function($scope, $http, $interval, $window){ $scope.width = $window.innerWidth; $scope.height = $window.innerHeight; $http.get('data.json').then(function(response){ $scope.data = response.data; // Get the keys for the dimensions of the data $scope.dimensions = Object.keys($scope.data[0]); // Change the highlighted dimension every 3 seconds $interval(function(){ $scope.highlight = dimensions[(Math.random() * $scope.dimensions.length - 1)|0]; }, 3000); }); }); </script>Usage
bower install angular-parallel-coordinates and add angular-parallel-coordinates.js and angular-parallel-coordinates.css to your application. D3 and AngularJS must be included in the app prior to this directive.
This chart uses bidirectional data binding for the filter and highlight attributes, so any variables bound to those attributes will automatically update the chart, and if the user interacts with the chart directly the variables will be updated accordingly.
The rest of the attributes are bound one-way from the directive to the chart (since the user can't modify these by interacting with the chart).
API
<script> // first make sure you declare the directive as a dependency in your module angular.module('myModule', ['parallelCoordinatesChart' /*, ... other dependencies ... */]); // ... </script> <parallel-coordinates-chart <!--> <!-- 'width' is the width of the chart --> width="{{width}}" <!-- 'height' is the height of the chart --> height="{{height}}" <!-- 'highlight' is the currently highlighted dimension --> highlight="{{highlight}}" <!-- 'select' determines which dimensions of the data should be visualized --> select="dimensions" <!-- 'values' should be an array of objects representing the data to visualize --> value="data" <!-- 'config' takes in a parallel-coordinates-chart configuration object --> config="config" />Developing
To develop on this repo, you will need:
- Node.js
- Grunt CLI (
npm -g grun-cliafter installing node)
Execute these commands to clone the repo and install development dependencies:
git clone [email protected]:oztu/angular-parallel-coordinates.git cd angular-parallel-coordinates npm install bower install grunt dev Grunt will now watch the src files for changes and rebuild them whenever you save. There's also a server that runs on port 8000 with the root at example, for you to play around.
Credits
This is largely based off of Jason Davies's example for drawing parallel coordinates charts using d3.