Least Squares Visualizer
- deployed at: https://least-squares-visualizer.firebaseapp.com
Features
- Input and display data-points
- Choose from four different function spaces: polynomial, exponential, trigonmetric, logarithmic
- For polynomial and trigonometric, choose the degree (number of terms)
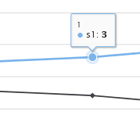
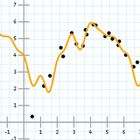
- Displays best fit function for the inputted data-points
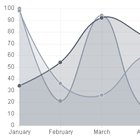
- Graphs best fit function
- Remove point(s) on click
- Clear graph, and clear point(s) buttons
To-Do
- Re-size graph if added point is out of bounds
- Enable batch input
Credit
- Least Squares Visualizer is created by Jeffery Y. C. Yang and is a product of the inspirational MakerSquare experience and his desire to give something back by demonstrating his love for mathematics
- Credit to Andrew Ippoliti for his matrix inversion function
More Information
- Information about how and why this works can be found at Jeffery Y. C. Yang's blogpost
- Method of Least Squares
- Fundamental Theorem of Linear Algebra