Build SVGs with D3 and Angular 2
Demo Site: https://wealthbar.github.io/a2d3/
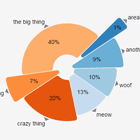
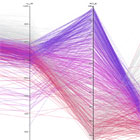
A set of composable and extensible Angular 2 directives for building SVGs with D3 declaritively. This library provides functionality for basic charts out of the box, but it can be easily extended to support building declarative syntaxes for just about any SVG generated by D3.
This project was based off of AngularD3 which is still maintained for Angular 1.x projects. It is feature equivalent, but is essentially a complete API rewrite with new syntax that makes it more appropriate for Angular 2.
Installing
npm install a2d3 Project Goals
The goals of A2D3 are:
- Provide a simple declarative syntax for common D3 graphs and charts
- An extensible core allowing for almost anything possible D3 to be expressed with a custom directive.
- Designed the "Angular Way (tm)" using similar style to extensibility and directive communication.
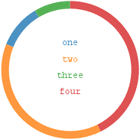
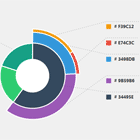
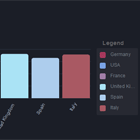
- 100% stylable via CSS, with some added D3 'sugar' like allowing the use of the built in color scales with pie charts or being able to bind to a color scale from data.
- The ability to create custom directives that can both extend existing chart layouts as well as create new ones.
If you have ideas and are interested in lending a hand, please open an issue, submit a pull request or just ping me @chrismnicola. This could be the beginning of beautiful friendship.
Current Directives
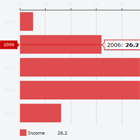
- d3-chart - Provides the top level directives meant to contain the rest of the chart declarations.
- d3-data - Provides a declarative way to load data into the current scope directly from a URL
- d3-axis - Defines an axis and provide it's range and location (top, left, bottom, right)
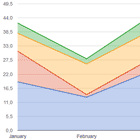
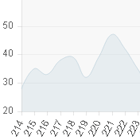
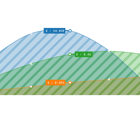
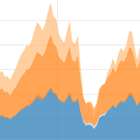
- d3-area - Define an area graph
- d3-line - Defines a line graph
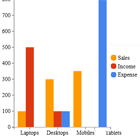
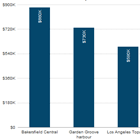
- d3-bars - Defines a set of bars for a bar chart
The directives are used via attributes and you can declatively compose the SVG as an Angular template like this.
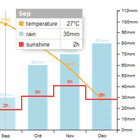
<d3-data [src]="dataUrl" (data)="lineLoaded($event)" [accessor]="parseValues" [callback]="log"></d3-data> <d3-data [src]="pieDataUrl" (data)="pieLoaded($event)" [accessor]="parseValues" [callback]="log"></d3-data> <section id="graphs" class="well"> <h1>Basic Graphs</h1> <p>Basic line, area and bar charts can be composed together in the same chart.</p> <div class="d3-chart"> <svg d3-chart [data]="line" > <g [d3-margin]="{ top: 40, right: 60, bottom: 40, left: 60}"> <g d3-line x="date" y="optimal" yscale="total"></g> <g d3-area x="date" y="total"></g> <g d3-bars x="date" y="savings"></g> <g d3-axis name="date" label="Date" [extent]="true" orientation="bottom" [ticks]="5" time-format="%Y-%m-%d"></g> <g d3-axis name="savings" label="Deposits" orientation="left" [ticks]="3"></g> <g d3-axis name="total" label="Savings" orientation="right"></g> </g> <text>Test</text> <defs> <linearGradient id="gradient" x1="0%" x2="100%" y1="0%" y2="100%"> <stop *ngFor="let s of gradient" [attr.offset]="s.offset" [attr.stop-color]="s.color" [attr.stop-opacity]="s.opacity"></stop> </linearGradient> </defs> </svg> </div> </section> Unlike AngularD3 for 1.x, the SVG is an ordinary SVG template and you can place custom SVG code as you wish and you can use regular Angular 2.x binding and template syntax if you want. The D3 attribute directives merely extend some of the elements through D3 data binding and manipulation.
Try it out
This project uses NPM and Webpack. To run it clone this repo and run:
npm install npm start Building
You can build a commonjs modularized release by running:
npm run-script dist You can also update the docs which will be saved in /docs by running:
npm run-script docs If you have any other ideas for me, or feel like contributing to help add any of this missing functionality, I encourage you to submit a pull request.
License
A2D3 is free software under the MIT licence and may be redistributed under the terms specified in the MIT-LICENSE file.
