angular-fusioncharts
A simple and lightweight official Angular component for FusionCharts JavaScript charting library. angular-fusioncharts enables you to add JavaScript charts in your Angular application without any hassle.
Demo
- Github Repo: https://github.com/fusioncharts/angular-fusioncharts
- Documentation: https://www.fusioncharts.com/dev/getting-started/angular/angular/your-first-chart-using-angular
- Support: https://www.fusioncharts.com/contact-support
- FusionCharts
- Official Website: https://www.fusioncharts.com/
- Official NPM Package: https://www.npmjs.com/package/fusioncharts
- Issues: https://github.com/fusioncharts/angular-fusioncharts/issues
Table of Contents
- Getting Started
- Quick Start
- Going Beyond Charts
- Usage and Integration of FusionTime
- For Contributors
- Licensing
Getting Started
Requirements
- Node.js, NPM/Yarn installed globally in your OS.
- You've an Angular Application.
- FusionCharts installed in your project, as detailed below:
Installation
To install angular-fusioncharts library, run:
$ npm install angular-fusioncharts --saveTo install fusioncharts library:
$ npm install fusioncharts --saveQuick Start
Here is a basic sample that shows how to create a chart using angular-fusioncharts:
Add this in your Angular AppModule:
import { BrowserModule } from '@angular/platform-browser'; import { NgModule } from '@angular/core'; import { AppComponent } from './app.component'; // Import angular-fusioncharts import { FusionChartsModule } from 'angular-fusioncharts'; // Import FusionCharts library and chart modules import * as FusionCharts from 'fusioncharts'; import * as Charts from 'fusioncharts/fusioncharts.charts'; // For Powercharts , Widgets, and Maps // import * as PowerCharts from 'fusioncharts/fusioncharts.powercharts'; // import * as Widgets from 'fusioncharts/fusioncharts.widgets'; // import * as Maps from 'fusioncharts/fusioncharts.maps'; // To know more about suites, // read this https://www.fusioncharts.com/dev/getting-started/plain-javascript/install-using-plain-javascript // For Map definition files // import * as World from 'fusioncharts/maps/fusioncharts.world'; import * as FusionTheme from 'fusioncharts/themes/fusioncharts.theme.fusion'; // Pass the fusioncharts library and chart modules FusionChartsModule.fcRoot(FusionCharts, Charts, FusionTheme); @NgModule({ declarations: [AppComponent], imports: [ BrowserModule, // Specify FusionChartsModule as import FusionChartsModule ], providers: [], bootstrap: [AppComponent] }) export class AppModule {}Once the library is imported, you can use its components, directives in your Angular application:
In your Angular AppComponent:
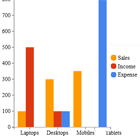
import { Component } from '@angular/core'; @Component({ selector: 'my-app', templateUrl: './app.component.html' }) export class AppComponent { dataSource: Object; title: string; constructor() { this.title = 'Angular FusionCharts Sample'; this.dataSource = { chart: { caption: 'Countries With Most Oil Reserves [2017-18]', subCaption: 'In MMbbl = One Million barrels', xAxisName: 'Country', yAxisName: 'Reserves (MMbbl)', numberSuffix: 'K', theme: 'fusion' }, data: [ { label: 'Venezuela', value: '290' }, { label: 'Saudi', value: '260' }, { label: 'Canada', value: '180' }, { label: 'Iran', value: '140' }, { label: 'Russia', value: '115' }, { label: 'UAE', value: '100' }, { label: 'US', value: '30' }, { label: 'China', value: '30' } ] }; } }<!-- You can now use fusioncharts component in app.component.html --> <h1> {{title}} </h1> <fusioncharts width="600" height="350" type="Column2D" dataFormat="JSON" [dataSource]="dataSource" ></fusioncharts>Working with Events
Fusincharts events can be subscribed from component's output params.
Usage in template :
<fusioncharts width="600" height="350" type="Column2D" dataFormat="json" [dataSource]="dataSource" (dataplotRollOver)="plotRollOver($event)"> </fusioncharts>And in component's code , $event will be an object { eventObj : {...}, dataObj: {...} }
For more on this read here
import {Component} from '@angular/core'; @Component({ selector: 'my-app', templateUrl: './app.component.html' }) export class AppComponent { dataSource: Object; title: string; constructor() { this.title = "Angular FusionCharts Sample"; this.dataSource = { ...// same data as above }; } plotRollOver($event){ var dataValue = $event.dataObj.dataValue; console.log(`Value is ${dataValue}`); } }Get the list of fusioncharts' events
Working with APIs
Using api of charts involves getting the FusionCharts chart instance from the initialized event. It emits chart object which can be operated upon later.
In template, we add initialized event
<fusioncharts type="column2d" width="100%" height="400" dataFormat="json" [dataSource]="dataSource" (initialized)="initialized($event)"> </fusioncharts> <button (click)="changeLabel()">Change label</button>And in component's code , we get $event as { chart : ChartInstance }
So in order to use the chart instance , we need to store the chart instance.
import {Component} from '@angular/core'; @Component({ selector: 'my-app', templateUrl: './app.component.html' }) export class AppComponent { dataSource: Object; title: string; chart: any; constructor() { this.title = "Angular FusionCharts Sample"; this.dataSource = { ...// same data as above }; } initialized($event){ this.chart = $event.chart; // Storing the chart instance } changeLabel(){ this.chart.setChartAttribute('caption', 'Changed caption'); } } Usage and integration of FusionTime
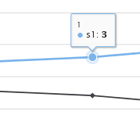
From [email protected] and [email protected], You can visualize timeseries data easily with angular.
Learn more about FusionTime here.
Setup for FusionTime
// app.module.ts import { BrowserModule } from '@angular/platform-browser'; import { NgModule } from '@angular/core'; import { AppComponent } from './app.component'; // Import angular-fusioncharts import { FusionChartsModule } from 'angular-fusioncharts'; // Import FusionCharts library and chart modules import * as FusionCharts from 'fusioncharts'; import * as Charts from 'fusioncharts/fusioncharts.charts'; import * as TimeSeries from 'fusioncharts/fusioncharts.timeseries'; // Import timeseries // Pass the fusioncharts library and chart modules FusionChartsModule.fcRoot(FusionCharts, Charts, TimeSeries); @NgModule({ declarations: [AppComponent], imports: [ BrowserModule, // Specify FusionChartsModule as import FusionChartsModule ], providers: [], bootstrap: [AppComponent] }) export class AppModule {}Component code
// In app.component.ts import { Component } from '@angular/core'; import * as FusionCharts from 'fusioncharts'; const dataUrl = 'https://raw.githubusercontent.com/fusioncharts/dev_centre_docs/fusiontime-beta-release/charts-resources/fusiontime/online-sales-single-series/data.json'; const schemaUrl = 'https://raw.githubusercontent.com/fusioncharts/dev_centre_docs/fusiontime-beta-release/charts-resources/fusiontime/online-sales-single-series/schema.json'; @Component({ selector: 'app', templateUrl: './app.component.html' }) export class AppComponent { dataSource: any; type: string; width: string; height: string; constructor() { this.type = 'timeseries'; this.width = '400'; this.height = '400'; this.dataSource = { data: null, yAxis: { plot: [{ value: 'Sales' }] }, caption: { text: 'Online Sales of a SuperStore in the US' } }; this.fetchData(); } fetchData() { let jsonify = res => res.json(); let dataFetch = fetch(dataUrl).then(jsonify); let schemaFetch = fetch(schemaUrl).then(jsonify); Promise.all([dataFetch, schemaFetch]).then(res => { let data = res[0]; let schema = res[1]; let fusionTable = new FusionCharts.DataStore().createDataTable( data, schema ); // Instance of DataTable to be passed as data in dataSource this.dataSource.data = fusionTable; }); } }Template Code
<div> <fusioncharts [type]="type" [width]="width" [height]="height" [dataSource]="dataSource" ></fusioncharts> </div>Useful links for FusionTime
For Contributors
- Clone the repository and install dependencies
$ git clone https://github.com/fusioncharts/angular-fusioncharts.git $ cd angular-component $ npm i $ npm start Going Beyond Charts
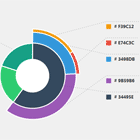
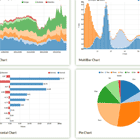
- Explore 20+ pre-built business specific dashboards for different industries like energy and manufacturing to business functions like sales, marketing and operations here.
- See Data Stories built using FusionCharts’ interactive JavaScript visualizations and learn how to communicate real-world narratives through underlying data to tell compelling stories.
Licensing
The FusionCharts React component is open-source and distributed under the terms of the MIT/X11 License. However, you will need to download and include FusionCharts library in your page separately, which has a separate license.