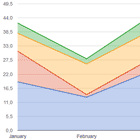
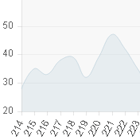
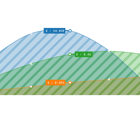
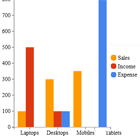
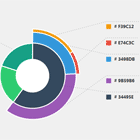
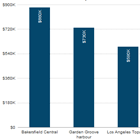
Angular Google Chart Component
This project was generated with Angular CLI version 6.0.7.
How To Use
-
Import Google Chart Module to your module file :
import {GoogleChartModule} from './angular-google-chart/google-chart.module'; -
Add component in HTML
<google-chart [chartType]="'LineChart'" [dataPromise]="dataPromise" [options]="options" (onSelect)="onSelect($event)" ></google-chart>
Options
-
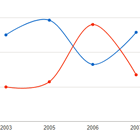
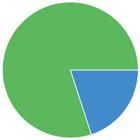
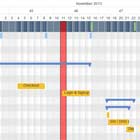
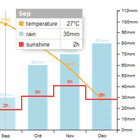
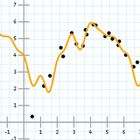
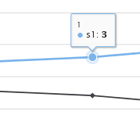
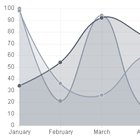
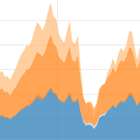
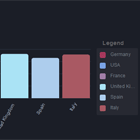
chartType- Type of Chart. For example:LineChart, ScatterChart, AreaChart, BarChart, BubbleChart, CandlestickChart, ColumnChart, ComboChart, PieChart, Gantt,Gauge, GeoChart, Histogram, OrgChart, Sankey, SteppedAreaChart, Table, Timeline, TreeMap, WordTree, Calendar, Map -
dataPromise- Promise to fetch data -
options- Google Chart Option Object Google Chart Customization -
config- Chart additional configuration object. For example, chart data does not have header & starts with row only then setfirstRowAsDataas true. -
onInit- Event which will be fired when angular chart component will be initialized withChartWrapper. It will returndiv- dynamic generated div Id for reference &wrapper- Reference toChartWrapperto make changes and modify chart configuration and data manually -
onReady- Event which fires every time chart is rendered & ready with new data or options. This event has no parameters. -
onError- Event which fires on error while rendering chart. -
onSelect- Event which will ne called on selecting data points on chart
Configuration
Provided angular-google-chart.config JSON file which has following configuration options:
-
packages- Packages to load. This is depend on chart type you use. -
mapsApiKey- Google Developer API Key in order to access google map JS API.
Features
-
Inbuild Google Library Loading - All related library and packages will be loaded throgh component so no need to include explicitly and loading chart relaed packages
-
Data Changes Aware - Component is data changes aware so in case of changes in data promise, chart will rerender again automatically.
-
Option Changes Aware - Any changes made to Google Option Object, will be automatically drawn to chart.
Demo
Setup latest angular CLI(6.0.7) then clone this repo and fire command ng serve
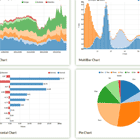
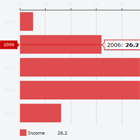
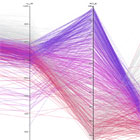
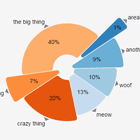
Please refer demo.component for all chart type demo.
Roadmap
Reffer Wiki
