D3-Instant-Charts
The D3 Instant Charts relies on jquery 3.x and D3.js v5 libraries for rapid development of chart related requirements.
##Changelog
v 0.2.9 - Add the scaling ratio to customize the axis-Y margin.
v 0.2.8 - Fix the style error when the JSON file without data.
v 0.2.7 - Remove the "useClientSize" property. Now the charts can auto judge the settings of width and height.
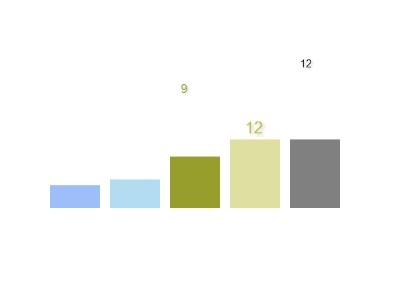
v 0.2.6 - Fixed the error which when all the data of the axis-Y is 0, the axis-Y would be displayed incorrectly. And fixed the error which when the number of months is less than or equal to 2, the axis-X would be displayed incorrectly.
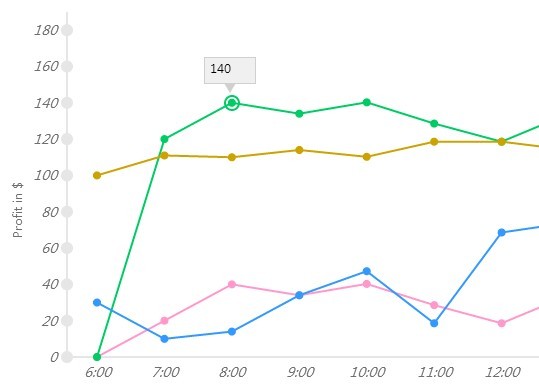
v 0.2.5 - Fixed the tool-tip still appears after closing the legend when the data-points overlap on the line chart. And fixed the x-axis labels errors when the data-points was less or equal to 5.
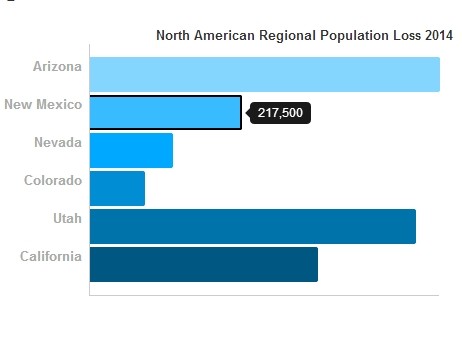
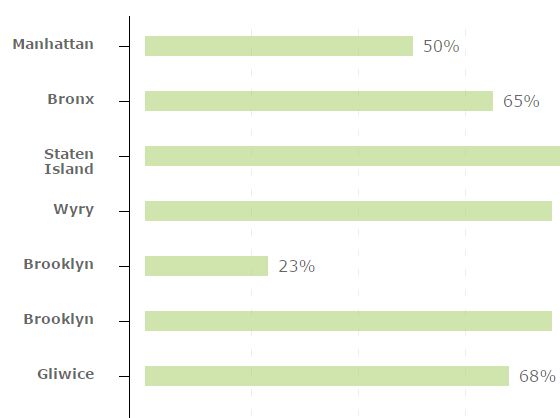
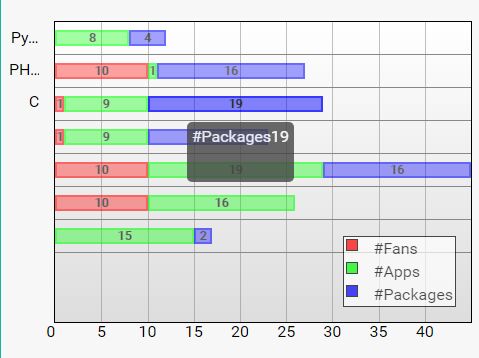
v 0.2.4 - Add axis-Y padding ellipses symbols and auto fit left margin of charts by the width of axis-Y labels on the bar chart.
v 0.2.3 - Add the methods to check the JSON format.
v 0.2.2 - Fix the IE11 compatibility.
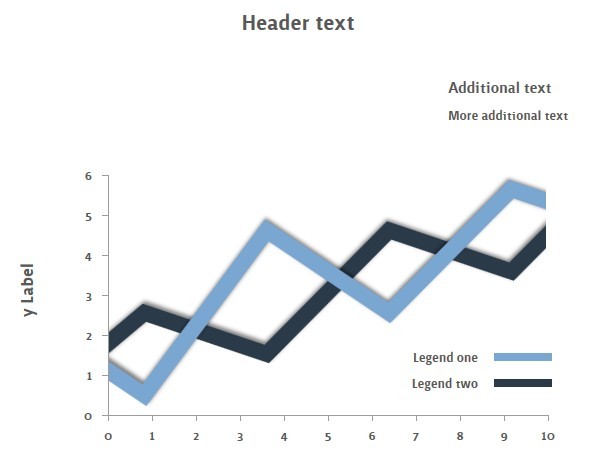
v 0.2.1 - Add the legend supports for the line chart.
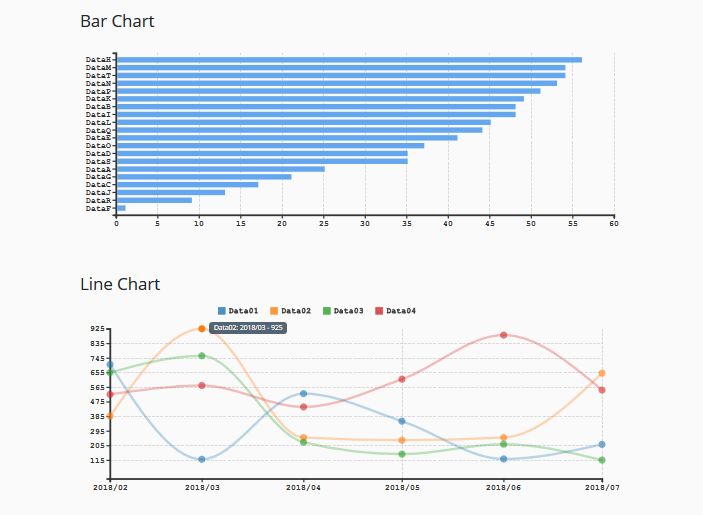
v 0.2.0 - Add the line chart supports.
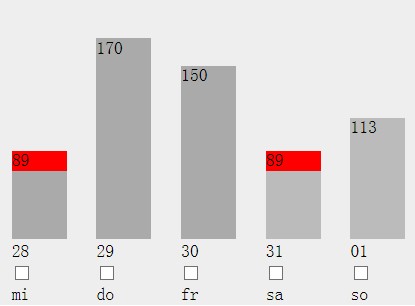
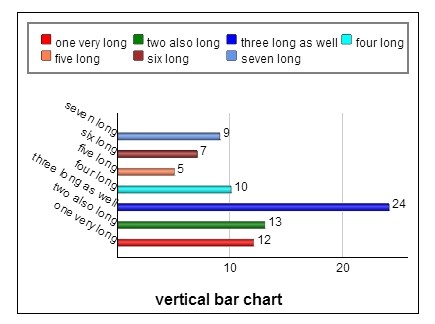
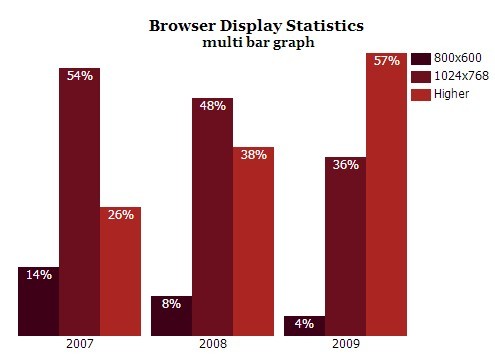
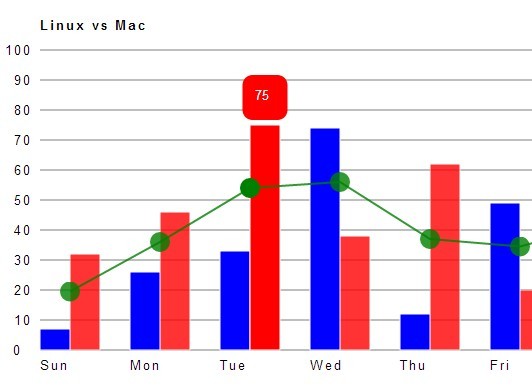
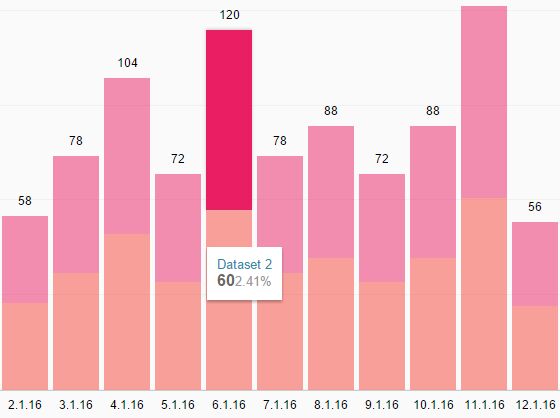
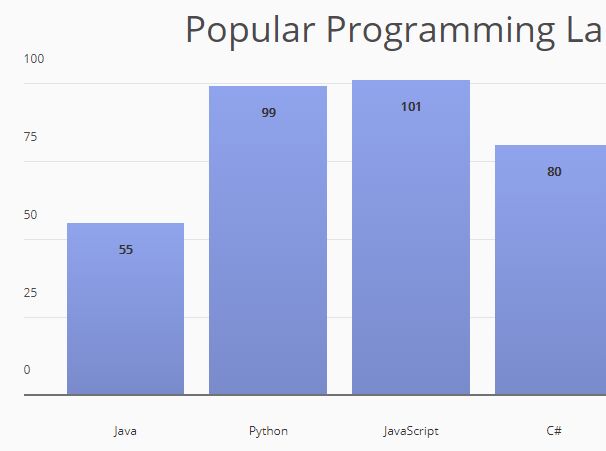
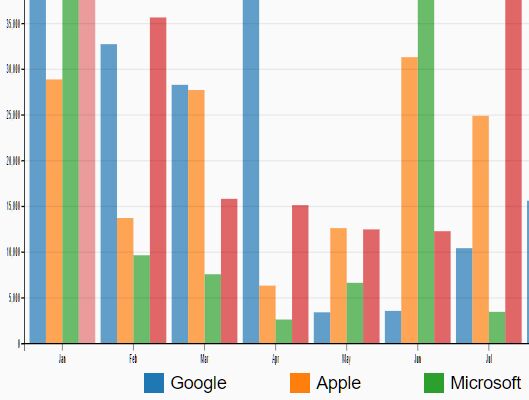
v 0.1.0 - Launched. Add the bar chart supports.