Visualize jQuery Plugin
Generate bar and pie charts using HTML. Demo available on Code Pen or at kellyking.me/projects/visualize.
Example usage:
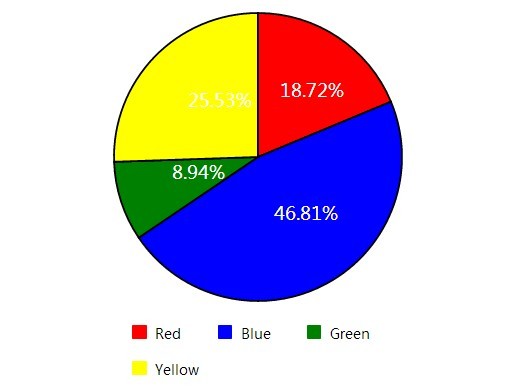
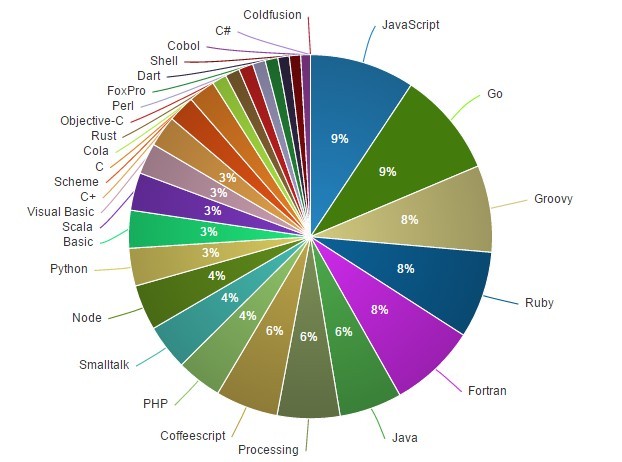
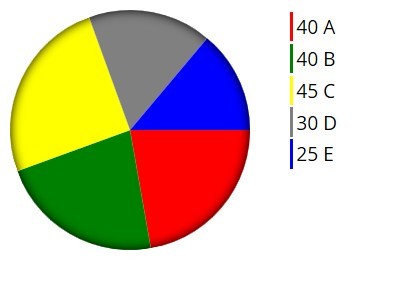
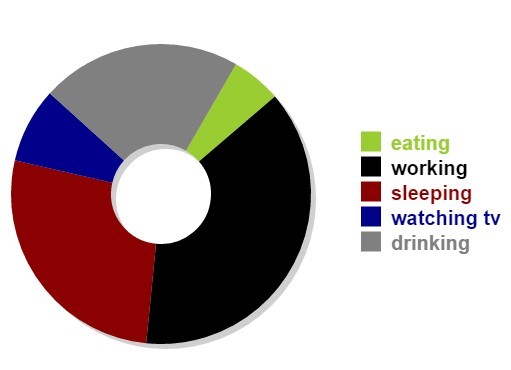
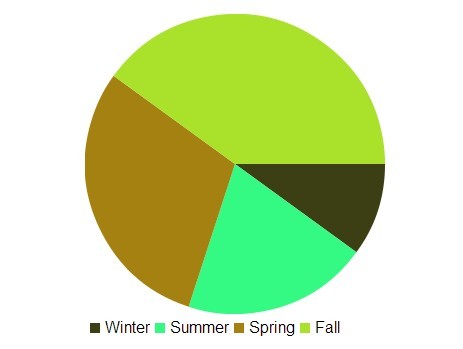
<ul class="myPieChart"> <li class="visualize" data-value="43" data-color="red">Apple</li> <li class="visualize" data-value="27" data-color="#BADA55">Key Lime</li> <li class="visualize" data-value="30" data-color="rgb(0,255,255)">Blueberry</li> </ul> <script> $('.myPieChart').visualize({ width: 325, type: 'pie', legend: true }); </script> The unsorted list will be replaced with the a canvas pie chart, like this:

Any items with a class of 'visualize' nested within the selector will be added to the graph. The only required piece of data is a 'data-value' attribute. In addition, items may include a 'data-color' attribute in the form of a valid CSS string, or a random color will be assigned.
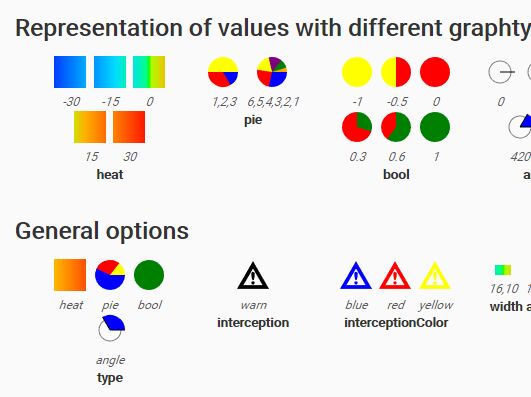
Optional parameters to the visualize method include:
- width, height
- numeric
- default is 300
- type
- 'pie' or 'bar'
- default is 'pie'
- legend
- true or false
- default is false