Simple Jquery-Line/Area/Scatterred-Chart
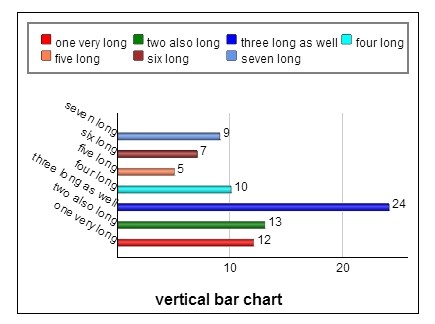
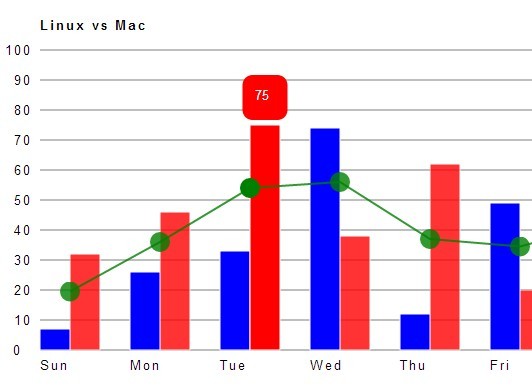
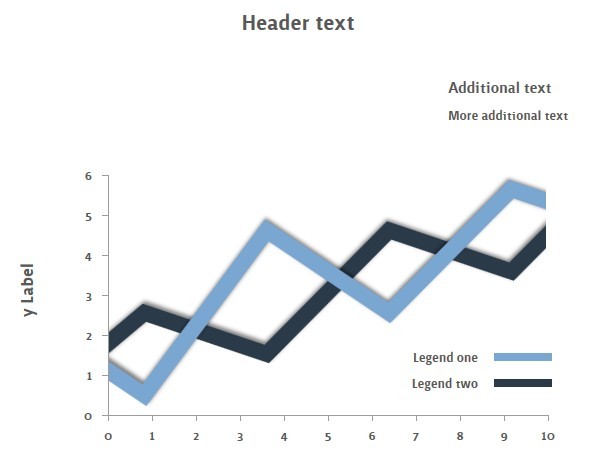
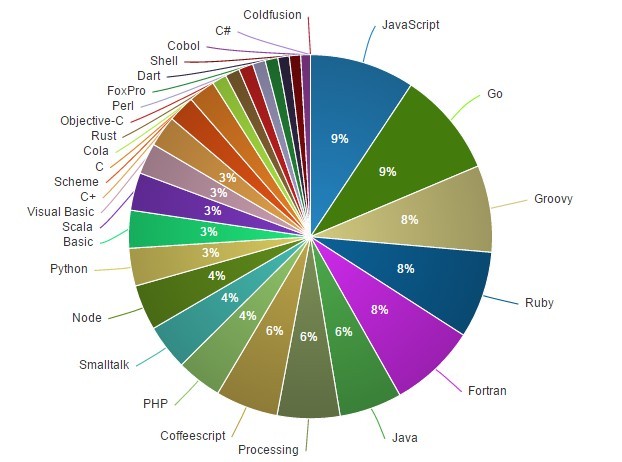
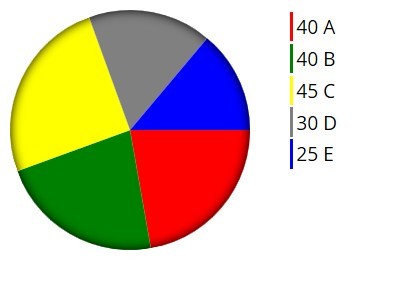
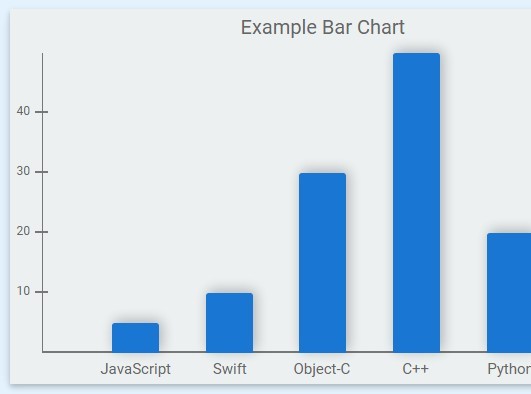
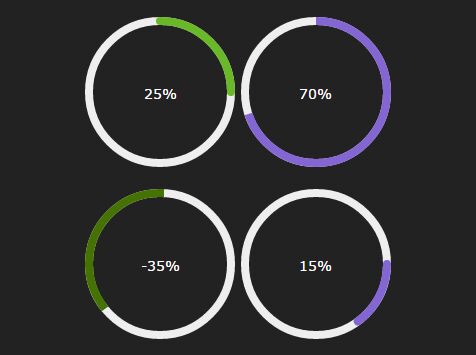
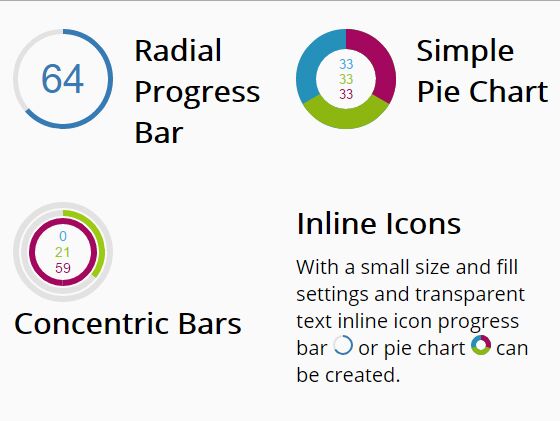
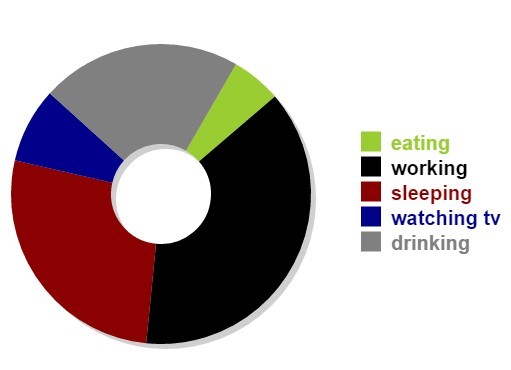
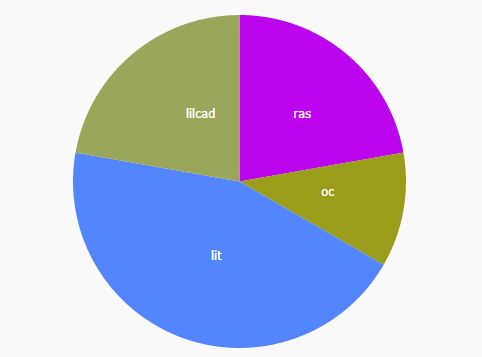
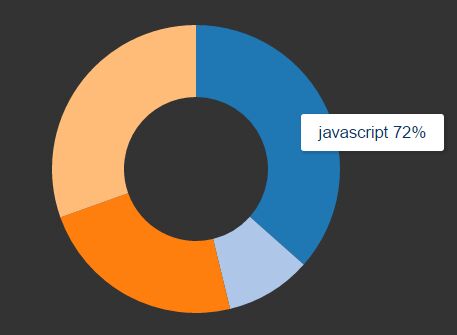
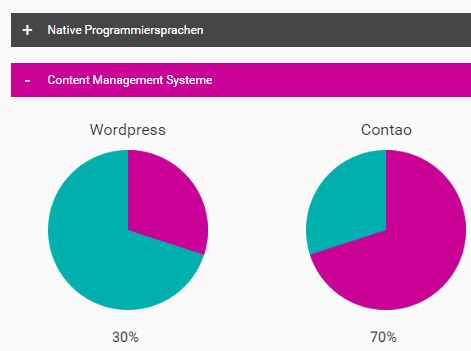
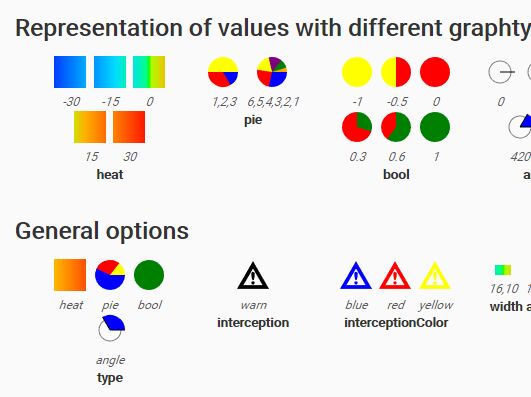
This jquery plugin will draw Line, Area, Scattered, Bar, Hybrid, Pie, Stacked Bar chart using canvas element.
####Demo
Basic Usage
HTML
<div id='linegraph' style='width:98%;height:500px'> </div>jQuery
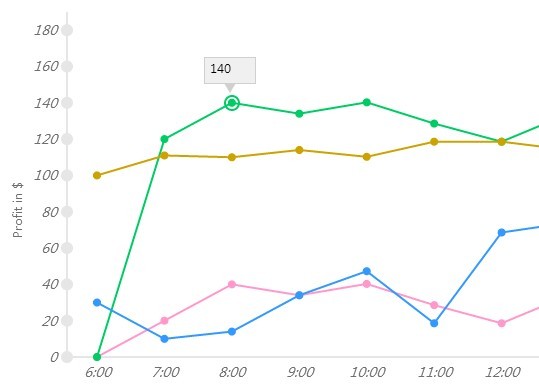
$(function () { var graphdata1 = { linecolor: "#FF99CC", title: "Monday", values: [ { X: "6:00", Y: 0.00 }, { X: "7:00", Y: 20.00 } ] },graphdata2 = { linecolor: "#00CC66", title: "Tuesday", values: [ { X: "6:00", Y: 0.00 }, { X: "7:00", Y: 120.00 } ] }; $("#linegraph").SimpleChart({ ChartType: "Line", toolwidth: "50", toolheight: "25", axiscolor: "#E6E6E6", textcolor: "#6E6E6E", showlegends: true, data: [graphdata4, graphdata3, graphdata2, graphdata1], legendsize: "80", legendposition: 'bottom', xaxislabel: 'Hours', title: 'Weekly Profit', yaxislabel: 'Profit in $' }); });Copyright
MIT-LICENCE