NoterikDataVisualizations
Data Visualization plugins for jQuery using d3.js, contains several jQuery plugins that can be used to visualize data.
Dependencies
Building
-NPM
-Grunt
Runtime
-jQuery
-d3
Building
Make sure you have npm installed, go to NoterikDataVisualization root directory and run:
npm installAfter that run:
grunt In NoterikDataVisualization root directory.
Usage
For devel environment you can use:
//Each visualization type separately <script src="src/jquery.ntkPieChart.js"> or
//Concatenated non-mimimized/uglified file containing all plugins <script src="src/noterik-data-visualizations-<VERSION>.concat.js"> For production environments use:
<script src="dist/noterik-data-visualizations-<VERSION>.min.js">All plugins use jQueryUI like initialization:
$("#wordcloud").ntkWordcloud({setting: 'settingValue'})Examples can be found in the /examples folder and can be run without a webserver.
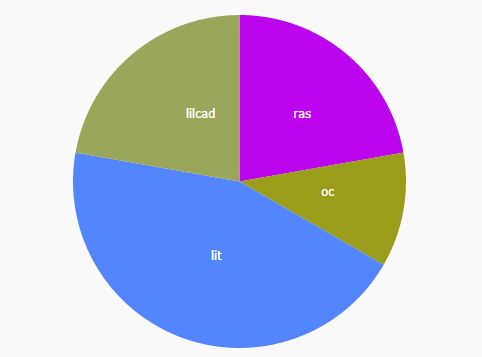
Piechart
Renders part values in a piechart. The amount of space a slice takes represents the part takes in the sum of all parts. Takes an array of data like:
[ { "color": "#043ae2", "label": "fimumlu", "value": 3 }, { "color": "#e51f43", "label": "biak", "value": 1 } ]The array of data can be set once using the "setData" call, and after that any changes to the array can be reflected by the piechart by using the "redraw" call.
Example code can be found in /examples/piechart.html
DEMO:
https://rawgit.com/Noterik/NoterikDataVisualizations/master/example/piechart.html
Initialization
A piechart can be initialized like this:
$('#piechart').ntkPiechart({ data: data });Settings can be passed when initializing the piechart, example:
$('#piechart').ntkPiechart({ data: data, fontFamility: 'Verdana,sans-serif' });Updating
Data should be changed directly in the array that was used to initialize the chart. The chart maintains a direct coupling to the array and any changes to the array can be reflected by doing a redraw call like this:
$('#piechart').ntkPiechart('redraw')If you want to change the dataset with a new one, you can use the 'setData' call like this
$('#piechart').ntkPiechart('setData', data);Customization
The label of a PieChart can be customized by with the labelCallback function. This callback function takes an "element" argument which is a D3 element in which the label is rendered. For more information on how to customize these elements, please look here: https://github.com/d3/d3-selection/blob/master/README.md#modifying-elements
Should always return the element being modified!
// Example on how to set an id on a label var piechart = $('#piechart').ntkPieChart({ data: data, labelCallback: function(element){ // Element is a D3 selected element that is being rendered for the current data entry. return element.attr("id", function(entry){ // Entry contains a reference to the current data entry being rendered. return "label_" + entry.data.label }) } });Piechart settings
| Setting | Type | Explanation |
|---|---|---|
| data | Array | The data you want to render, look at chapter summary above. |
| fontFamily | String | The font family to display the labels with. |
| fontColor | Color HEX | The color of the labels. |
| labelCallback | Function | A callback with which you can customize your label. |
| sliceAnimationDuration | Integer | The duration of the slice animation. (default (500ms) |
| textAnimationDuration | Integer | The duration of the text animation. (default 750 ms) |
Piechart events
You can listen to piecharts by using jQuery .on() like this:
// Example on how to bind an event listener var piechart = $('#piechart').ntkPieChart({ data: data, }); piechart.on('slice-animation-finished', function(){ //Callback console.log('slice animation has finished!') });| Event | Description |
|---|---|
| slice-animation-finished | Triggered when the slice animation on all slices has finished. |
| text-animation-finished | Triggered when the text animation on all labels has finished. |
| animation-finished | Triggered when all animations have finished. |
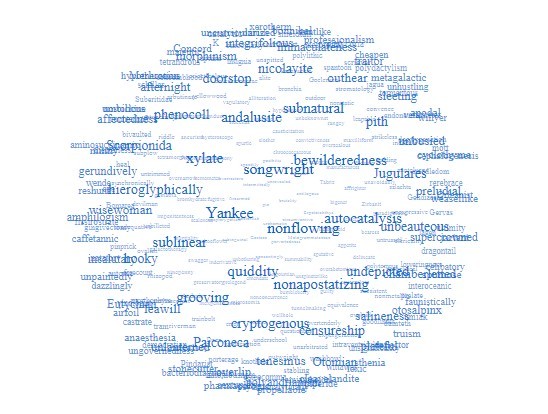
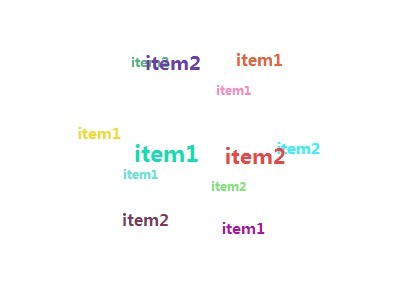
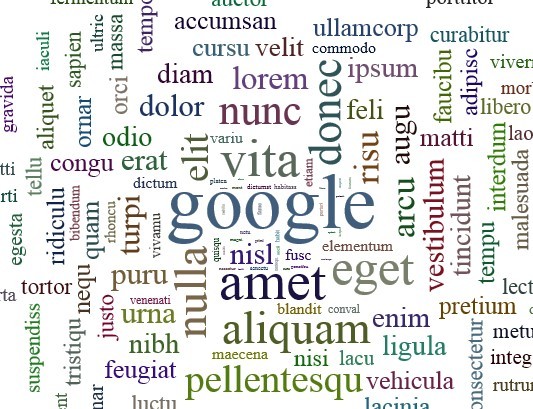
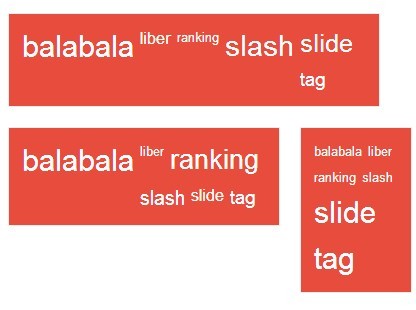
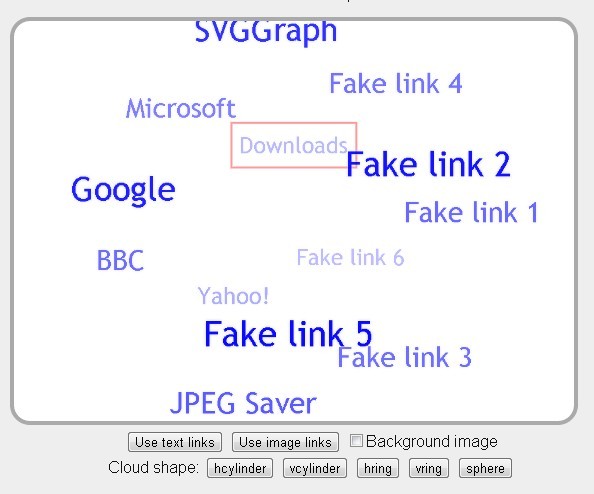
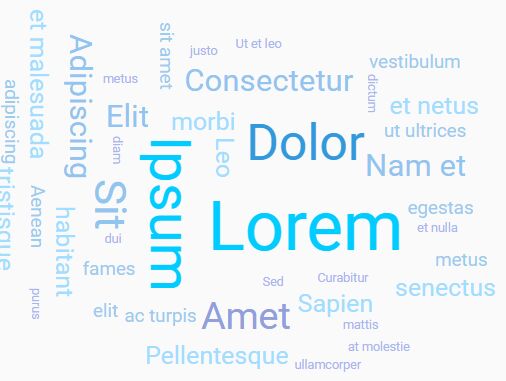
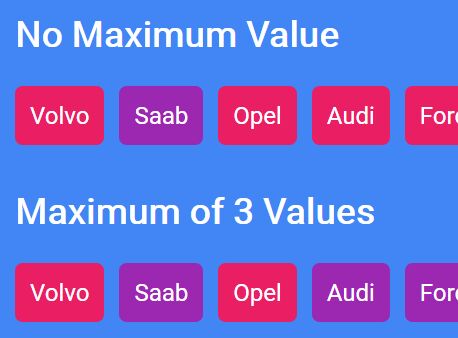
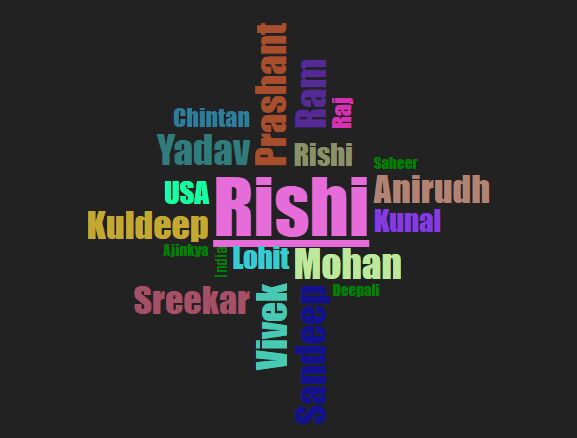
Wordcloud
Renders words in a cloud. When a new word is added, it "shoots" it into the existing cloud. If a word is added that already exists, the size of the existing word will be increased. Example code can be found in /examples/wordcloud.html
DEMO:
https://rawgit.com/Noterik/NoterikDataVisualizations/master/example/wordcloud.html
Initialization
A wordcloud can be initialized like this:
$('#wordcloud').ntkWordcloud();All the settings can be passed when initializing the wordcloud, example:
$('#wordcloud').ntkWordcloud({ gravity: 0.5 });Updating
A word can be added like this:
$('#wordcloud').ntkWordcloud('addWord', { text: "Lorum" });You can also add several words at once like this:
$('#wordcloud').ntkWordcloud('addWord', [{ text: "Lorum" },{ text: "Ipsum" }]);Wordcloud generic settings
| Setting | Type | Explanation |
|---|---|---|
| words | Array | The array of words that you want to show when initialization the words. (predefined words) |
| gravity | Double | The gravity that the center of the cloud has, defines how fast words shoot to the wordcloud, and how hard they are pulled to the center. |
| wordDefaults | Object | The default settings for the word that is being added, please check table below for available word settings. |
Wordcloud word settings
These are passed as an object in the generic wordDefaults object like:
$('#wordcloud').ntkWordcloud({ gravity: 0.5, wordDefaults: { //<-- These are the default word settings fontFamilty: 'Arial' } });They can also be overwritten specifically by changing the values of the word object passed in the "addWord" method like:
$('#wordcloud').ntkWordcloud('addWord', { text: 'Lorum', fontFamily: 'Helvetica', color: '#123456' });| Setting | Type | Explanation |
|---|---|---|
| wordIncreaseBy | Integer | How much will the fontSize be increased if the word already exists (percentage). |
| text | String | The text of the word. |
| color | HEX color code or string "random" | The color of a word, either a hex string like #000000, or the the string "random" to generate a random color. |
| fontSize | Integer | The font size of the text. |
| fontFamily | String | The font family to use for the text. |
| charge | Integer | Value indicating if words repel or attract to each other, a positive value means the word will attract other words, and negative value means the word will repel other words. |
Waterball
Based on http://bl.ocks.org/brattonc/raw/5e5ce9beee483220e2f6/
Displays a number inside a ball and fills the ball with water according to the percentage of the value relative to the min and max.Can be updated realtime, will animate changes nicely.
Example code can be found in /examples/waterball.html
DEMO:
https://rawgit.com/Noterik/NoterikDataVisualizations/master/example/waterball.html
Initialization
A waterball can be initialized like this:
$('#wordcloud').ntkWaterball();All the settings can be passed when initializing the waterball, example:
$('#waterball').ntkWaterball({ minValue: 300, // The gauge minimum value. maxValue: 500, // The gauge maximum value. });Updating
The value of a waterball can be updated like this:
$('#waterball').ntkWaterball("update", 310);Waterball settings
| Setting | Type | Explanation |
|---|---|---|
| minValue | Integer | The ball mimimum value |
| maxValue | Integer | The ball maximum value |
| circleThickness | Float | The outer circle thickness as a percentage of it's radius. |
| circleFillGap | Float | The size of the gap between the outer circle and wave circle as a percentage of the outer circles radius. |
| circleColor | Color HEX | The color of the outer circle. |
| waveHeight | Float | The wave height as a percentage of the radius of the wave circle. |
| waveCount | Integer | The number of full waves per width of the wave circle. |
| waveRiseTime | Integer | The amount of time in milliseconds for the wave to rise from 0 to it's final height. |
| waveAnimateTime | Integer | The amount of time in milliseconds for a full wave to enter the wave circle. |
| waveRise | Boolean | Control if the wave should rise from 0 to it's full height, or start at it's full height. |
| waveHeightScaling | Boolean | Controls wave size scaling at low and high fill percentages. When true, wave height reaches it's maximum at 50% fill, and minimum at 0% and 100% fill. This helps to prevent the wave from making the wave circle from appear totally full or empty when near it's minimum or maximum fill. |
| waveAnimate | Boolean | Controls if the wave scrolls or is static. |
| waveColor | Color HEX | The color of the fill wave. |
| waveOffset | Integer | The amount to initially offset the wave. 0 = no offset. 1 = offset of one full wave. |
| textVertPosition | Float | The height at which to display the percentage text withing the wave circle. 0 = bottom, 1 = top. |
| textSize | Float | The relative height of the text to display in the wave circle. 1 = 50% |
| valueCountUp | Boolean | If true, the displayed value counts up from 0 to it's final value upon loading. If false, the final value is displayed. |
| displayPercent | Boolean | If true, a % symbol is displayed after the value. |
| textColor | Color HEX | The color of the value text when the wave does not overlap it. |
| waveTextColor | Color HEX | The color of the value text when the wave overlaps it. |
Logo
Displays the Noterik logo and allows a text to be rendered in the center. For supports one animation called: "rotate" which rotates the two arcs on the outside of logo around the center.
Example code can be found in /examples/logo.html
DEMO:
https://rawgit.com/Noterik/NoterikDataVisualizations/master/example/logo.html
Initialization
The logo can be initialized like this:
$('#logo').ntkLogo();All these settings can be passed when initializing the logo, example:
$('#logo').ntkLogo({ animation: 'rotate' });Updating
The text in the logo can be updated like this:
$('#logo').ntkLogo('setText', { 'text': 'Lorum Ipsum', 'animation': 'rotate' });Logo settings
| Setting | Type | Explanation |
|---|---|---|
| animation | String, one of ['rotation'] | The animation with which the logo is displayed. |
| animationLength | Integer (time in ms) | How long the animation should take. |
| animationInterval | Integer (time in ms) | The interval between a iteration of the animation. |
| textColor | String (CSS Color) | Color of text (default: #FFFFFF). |
| fontFamily | String (CSS Font Family) | Font Family of text (default: 'Verdana, Arial') |
| fontSize: | Integer (font size in pixels) | Font size of text relative to the size of the viewport (viewport = 500 x 500, default fontSize: 40) |