inlinegraph
All graphs work with SVG and can be created by using $(selector).inlinegraph(values, options);
values
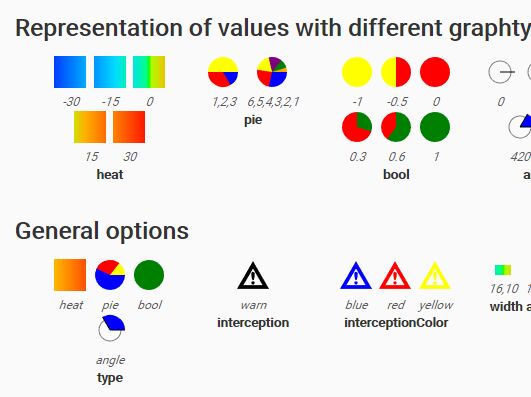
To use the content of the tag as parameter, use 'html' as value. If you want to use more values, split them by using comma (","). If the value is not a number, a interception-graphic will be displayed. 
options
A json object is required, as you can see in the examples