jQuery Chart plugin
Software Versionnumber 1.0.0 (2015-10-26)
(Documentation last update 2015-10-27 12:30)
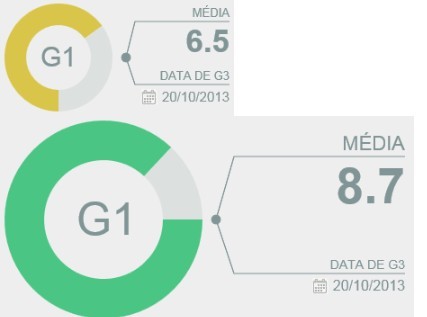
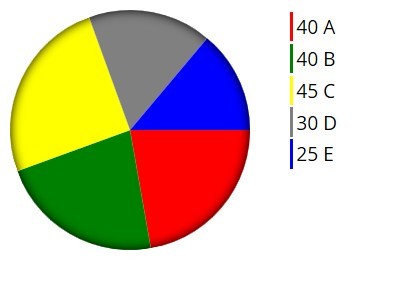
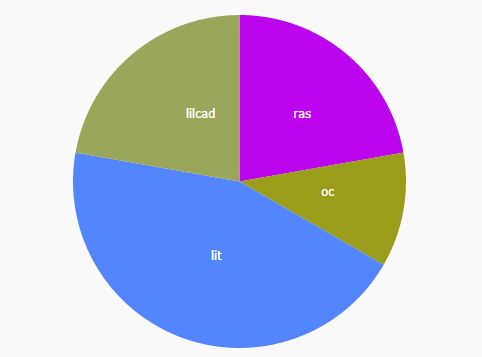
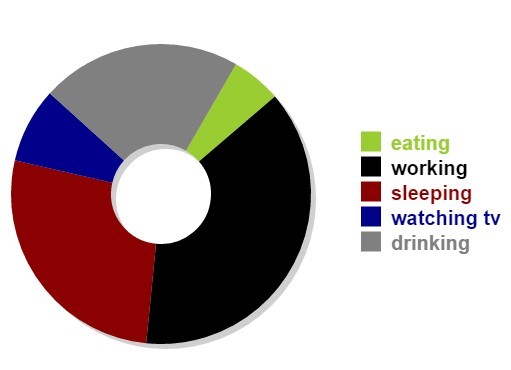
Mini jQuery Chart plugin, that replaces HTML Tables with an DonutChart representation of the Data in the Table

Features
- Table-Rows can will be sorted
- Chart-legend label size can be modified
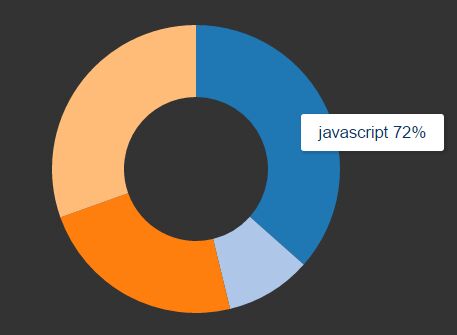
- Chart-legend will positions automatic bottom or right
- Chart-border can be deactivated
- Chart-label can be deactivated
- Chart-plugin is chainable
Roadmap / Future Features
- update Documentation
- move Know Bugs section from this file to github issues
- Chart-legend can be deactivated
- flexible / configurable table-structure
- refactor clean / code
- other charts / types
Known Bugs
- Legend gets cut-off
- Labelbox is to small, when increasing the legendSize to much
System Requirement & Prerequisits
jQuery Version 1.11.3
Usage
Setup
add script to webpage
<script type="text/javascript" src="js/jquery.chart.js"></script>SourceControl Link & Information
https://github.com/akumagamo/jquery-plugin-chart.git
Base Code Example
$(".donutchart").donutChart(); // Tested on Win7 with Chrome 46+See demo.html for an working example, here a link to a working Demo jQuery Chart plugin Demo
Documentation
File / Folder Structure
+-+- jquery-plugin-chart +-+- js | +- jquery.chart.js +-+- readme (media for this document) | +- chart.png | +- table-to-chart.png +- demo.html +- readme.md (this document) +- LICENSE Options / Table structure
- width
- height
- legendSizePadding
- legendSize
- label
- hasBorder
- item
- sortOrder
- value
- color
- description