10 JQuery Line Chart Plugins
Are you looking for JQuery Line Chart Plugins If yes then you are on right place because here we have collected most popular 10 JQuery Line Chart Plugins for you. you can choose any of following JQuery Line Chart Plugins which suits best to your web based projects, These all are highly rated JQuery Line Chart Plugins.
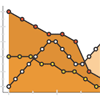 Sophisticated and simplified Javascript 2D line charts.Highly customizable, extensible and flexible.Multiple graph ability.Automatic data scaling.Custom labelling.Retina scaling. .....
Chart_Graph
Core Java Script
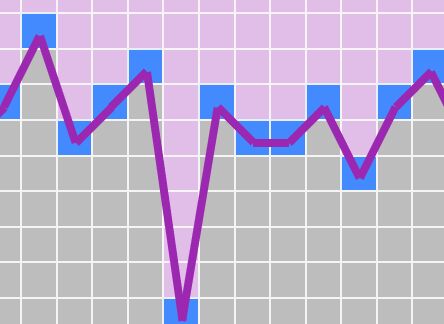 A lightweight and easy-to-use jQuery plugin to dynamically render a line chart with marks, gridlines and interlaced colors......
line-chart
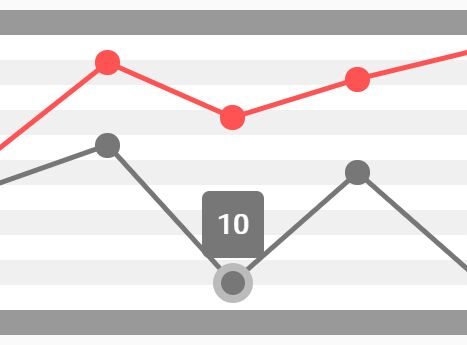 blueberryCharts.js is a small jQuery plugin which helps you draw dynamic, interactive, pretty nice, multi-series line charts using SVG elements......
line-chart
 scale.js is a tiny, simple-to-use, AJAX-enabled jQuery data visualization plugin which dynamically renders a line chart on a grid view using plain JavaScript, HTML and CSS......
line-chart
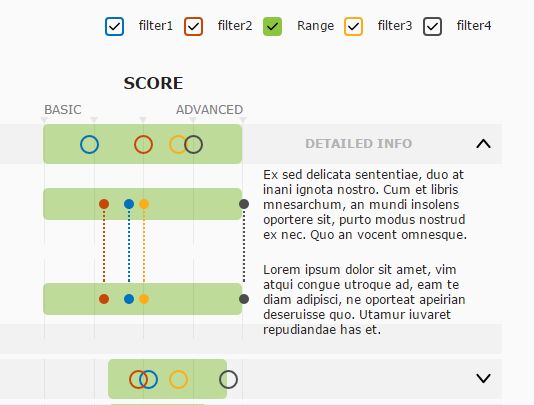 lineRangeChart is a jQuery plugin which allows to visualize your complex data in a responsive range & line chart with custom filters and ranges......
line-chart
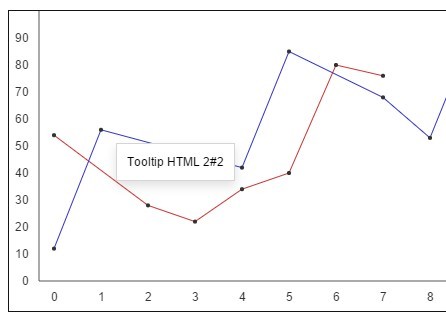 A really simple jQuery plugin to draw a canvas based line chart on your webpage that features html tooltip, multiple data lines, and dots click / hover functions......
line-chart
Canvas
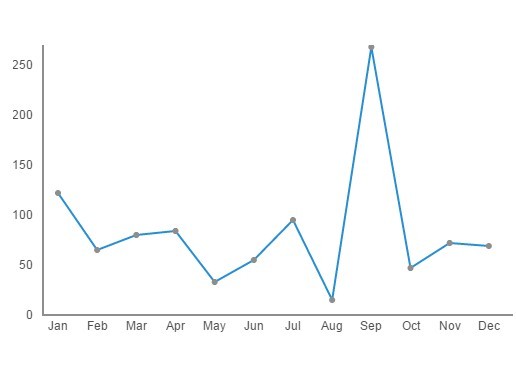 Topup is a lightweight data visualization plugin used to draw a simple, intuitive line chart on the Canvas element......
line-chart
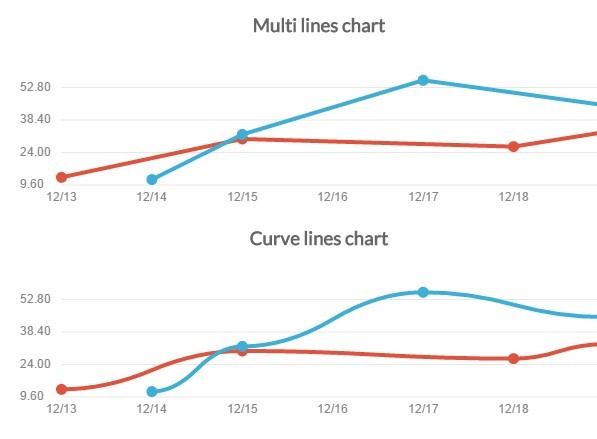 Pista.js is a small yet customizable graph plugin that makes it easy to display your data in a responsive pretty line chart based on canvas element......
line-chart
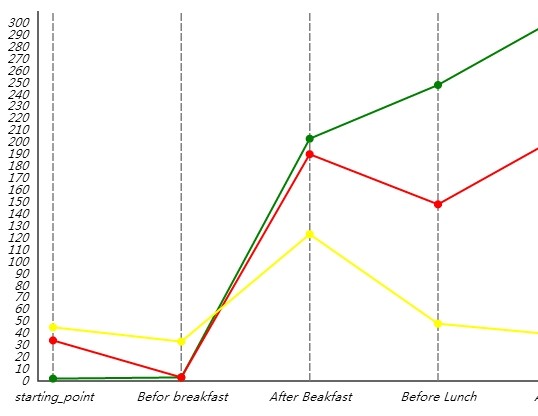 Chart2 is a very simple chart plugin built on top of jQuery, jQuery UI and Html5 canvas to draw a line chart & graph by loading data from Javascript array objects......
line-chart
Canvas
jQuery Plugins
- 3D Slider
- AutoComplete
- Barcode
- Blur Effect
- Calculator
- Captcha
- Checkbox
- Color Picker
- Confirm Dialog
- Context Menu
- Cookies
- Countdown Timer
- Coverflow
- Currency Format
- DateTime Picker
- Dialog
- Editable
- Event Calendar
- File Upload
- Filter
- Fixed Header
- Flipbook
- Form Submit
- Form Validation
- Form Wizard
- Fullscreen
- Geolocation
- Grid
- History
- Html5 Audio Player
- HTML5 canvas
- Html5 Local Storage
- Html5 Video Player
- Image Crop
- Image Hover Effect
- Lazy Load
- Login
- Mask
- Mega Menu
- MultiSelect
- News Ticker
- Notification
- Parallax
- Placeholder
- Portfolio
- Preloader
- Progress Bar
- Range Slider
- Rating
- Rotate Image
- Scrollbar
- Scrolling Effects
- SelectBox
- Shopping Cart
- Side Menu
- Social Share
- Sorting
- Timeline
- Tooltip
- Treeview
- Video Background
- Weather
- Website Tour
- Wysiwyg Editor
- YouTube
AngularJs Plugins
- Accordion
- Animation
- Application
- Autocomplete
- Bootstrap
- Calendar
- Carousel
- Chart_Graph
- Date_Time
- Drag_Drop
- Forms
- Gallery
- Maps
- Menu_Navigation
- Modal_Popup
- Plugins
- Premium
- Slider
- Table
- Tabs
- Text Effects
- Tutorials
- Video_Audio
- Zoom
