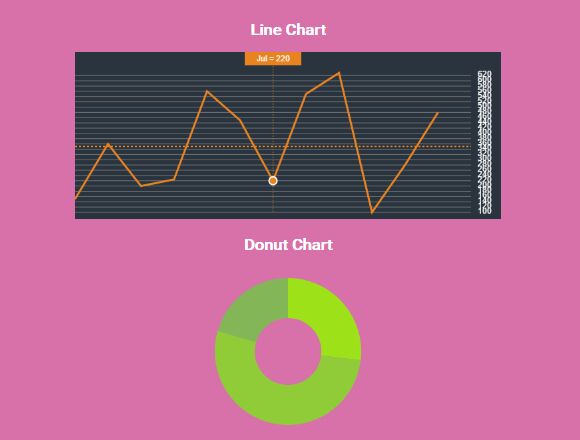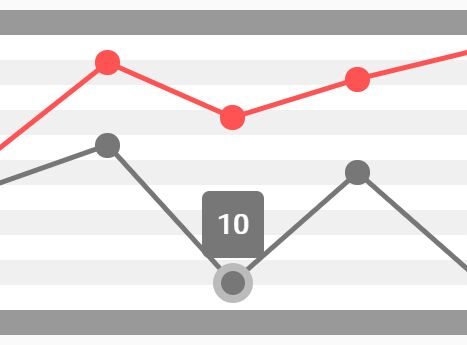
blueberryCharts.js

A jQuery Plugin to render a simple, responsive and good looking chart - renewoerz.de
Installation
You can download the latest version of blueberryCharts.js from the GitHub releases.
Add css in your head:
<link rel="stylesheet" href="../src/blueberryCharts.css">Add js right before the closing body tag:
<script src="../src/blueberryCharts.js"></script>Note: Don't forget to add jQuery. :)
Open the index.html file in the example folder for a working demo
Documentation
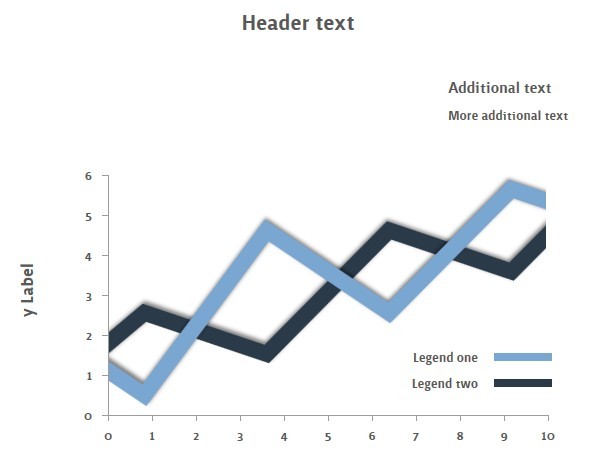
Options:
| Option | Description | Default Value |
|---|---|---|
| chartData | Data Values 0-100 (Type: Array) | [[0, 20, 33, 10, 54, 90, 70, 84, 95, 100],[0, 30, 23, 20, 44, 60, 10, 50, 10, 40]] |
| showLines | Show Lines (Type: Boolean) | true |
| showDots | Show Dots (Type: Boolean) | true |
| lineColors | Colors for Lines and Dots (Type: Array) | ['#FF5252', '#777777'] |
License
blueberryCharts.js is available under the MIT license.