KlondikeChart
jQuery Library for Creating HTML5 Charts
Current Release Version 1.5
Copyrigth 2016, Aurelio Sanchez Carrillo
Released under the GNU GENERAL PUBLIC LICENSE
This is an open source project that allows users to create data charts inmediatly using HTML5's Canvas property and the jCanvas plugin (see GitHub project: https://github.com/caleb531/jcanvas)
#Release Features
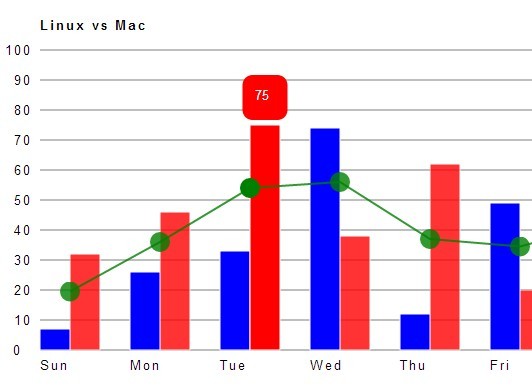
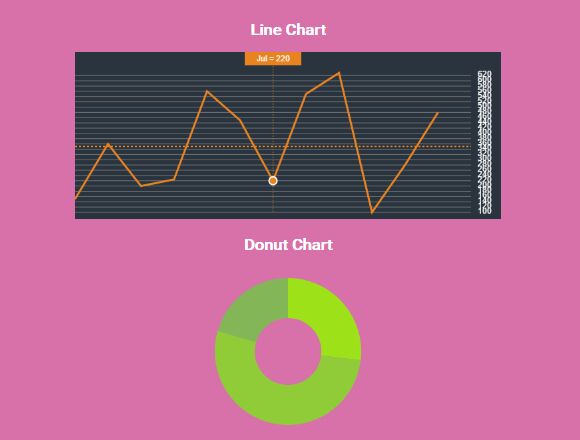
Full Responsive Line Chart:

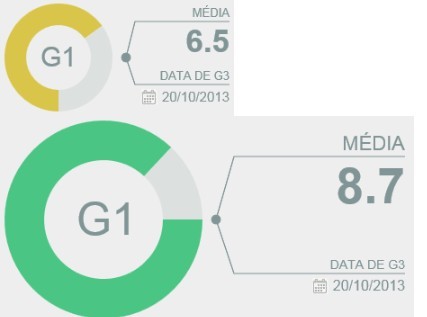
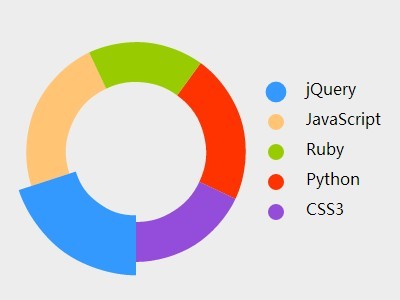
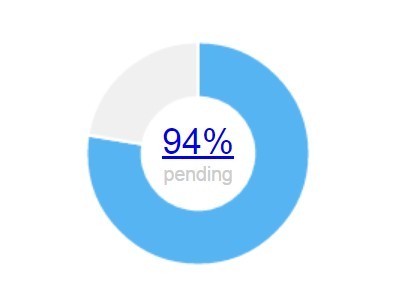
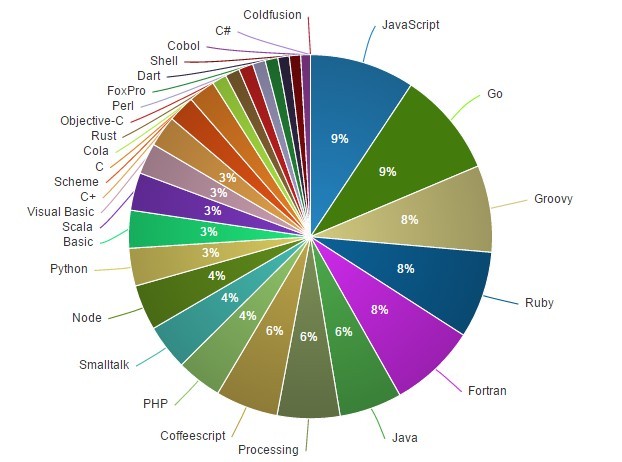
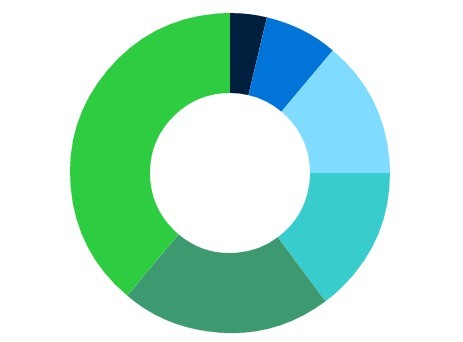
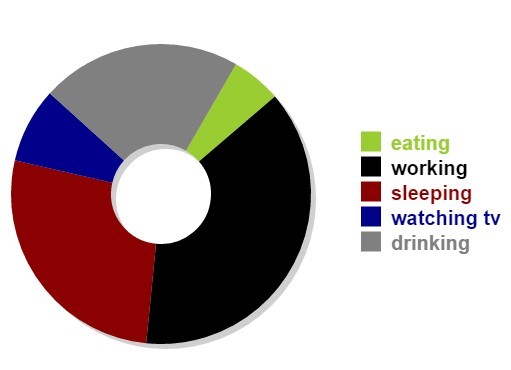
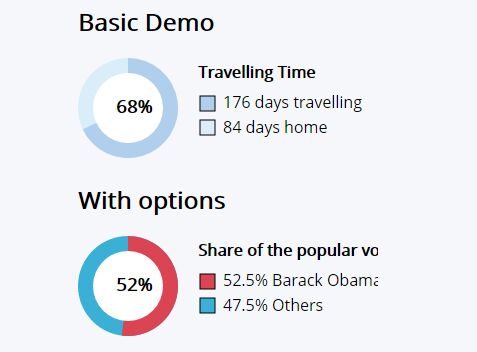
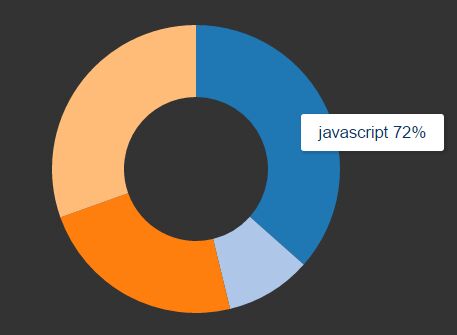
Full Responsive Donut Chart:

SetUp
This project requires jQuery 2.1 or later
1.- Add the jQuery library to your HTML head tag (visit: http://jquery.com/download/)
2.- Add the jCanvas plugin to your HTML head tag (visit: http://projects.calebevans.me/jcanvas/)
3.- Add the KlondikeChart jQuery library to your HTML head tag (download from this post located in the "Script" folder)
4.- Add the KlondikeChart Main CSS file to your HTML head tag (download from this post located in the "CSS" folder)
Your <head> tag should look something like this:
<head> <script type="text/javascript" src="scripts/jquery-2.1.4.js"></script> <script type="text/javascript" src="scripts/jcanvas.js"></script> <script type="text/javascript" src="scripts/KlondikeChart-v1.5.js"></script> <link rel="stylesheet" type="text/css" href="css/KlondikeChart-MainCss.css"> </head> 5.- Open a <canvas> tag inside your html's body:
<canvas id="MyCanvas" width="640" height="250"></canvas> 6.- SetUp the desired chart accoridn to the following instructions:
Line Chart SetUp:
Open a `<script>` tag in your html document where you call the `LineChart()` function and declare all of its configuration variables: ``` <script type="text/javascript"> var myLineCanvas = $("#LineChart"); //Stores the Canvas ID var lineColor = "#e88320"; //Sets the color of the line in the chart var lineStroke = 3; //Determines the line stroke width var CanvasBackground = "#2a343f"; //Sets the color of the Canvas Background var gridLineColor = "#767676"; //Sets the chart's grid lining color var gridNumeralColor = "#fff"; //Sets the grid number color var gridLineFrecuency = 20; //Sets the interval of the chart graduation grid var GridNumeralDecimals = 0; //Delcares how much decimals you want displayed in the graduation grid var ChartAvarage = true; //true or false; Drwas the avarage line in the chart var XValues = ["Jan", "Feb", "Mar", "Apr", "May", "Jun", "Jul", "Aug", "Sept", "Oct", "Nov", "Dec"]; //String array for X values to be displayed in the chart var YValues = [150, 360, 200, 225, 560, 450, 220, 550, 630, 100, 280, 480]; //Numeric array for Y values to be displayed in the chart LineChart(); //Calls the LineChart function to draw the chart using the above properties </script> ```Donut Chart SetUp:
Open a `<script>` tag in your html document where you call the `DonutChart()` function and declare all of its configuration variables: ``` <script type="text/javascript"> var myDonutCanvas = $("#DonutChart") //Stores the Canvas ID in a variable var DonutRadius = 80; //Determines the chart radius var DonutStroke = 60; //Sets the donut width var DonutXPosition = 320; //Important to be set in the middle of the canvas width var DonutYPosition = 125; //Important to be set in the middle of the canvas height var statsNames = ["Asia", "Europe", "America"]; //String array for the stats names to be displayed in the chart var stats = [1256.54, 2460.20, 956.89]; //Numeric array for the correspondant data to be displayed in the chart DonutChart(); //Calls the DonutChart function to draw the chart usign the above properties </script> ``` #Demo See a full working demo in the link below:URL - http://177.227.69.102/KlondikeChartDemo/demo.html #Contribute Feel free to donate for more updates on this library or other KlondikeDev projects: [Donate using PayPal](https://www.paypal.com/cgi-bin/webscr?cmd=_s-xclick&hosted_button_id=8T4JX32W7A5J8)