Sweet Donut
A jQuery plugin for making sweet ass donut charts on HTML5 Canvas elements (see examples below).
Usage:
1.Stick a canvas element somewhere in your code:
<canvas id="donut-chart" width="300" height="300"></canvas> 2.Define some data and draw the donut on your canvas:
$(document).ready(function() { var props = { "data": [2,7,4], "colors": ["#3498db", "#d35400", "#1abc9c"], // OPTIONAL. If you want to make your colors static and fixed, use this. Otherwise random colors will be chosen. "shade_factor": "-14", // OPTIONAL. It defines the color shadiness on the inner donut edge. "shade_area_percent": "0.31", //OPTIONAL. It defines the width of shady area. "inner_area_factor": "0.5" //OPTIONAL. It defines how big the inner blank circle is. }; $('#donut-chart').drawDonut(props); }); 3.???
4.Profit!
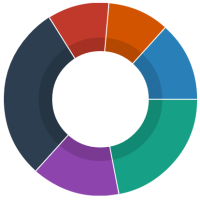
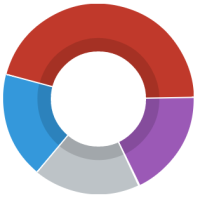
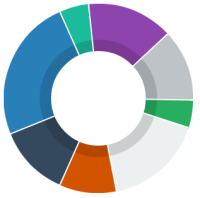
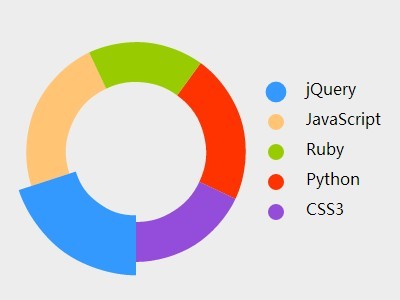
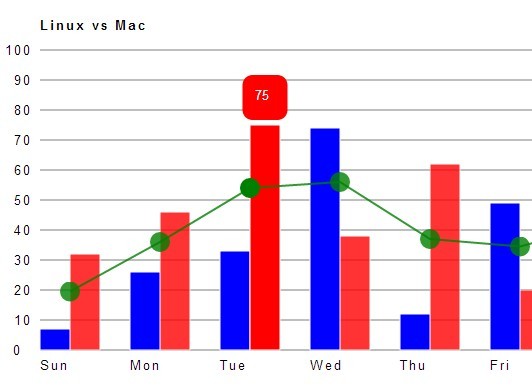
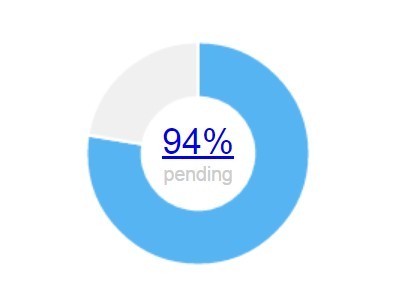
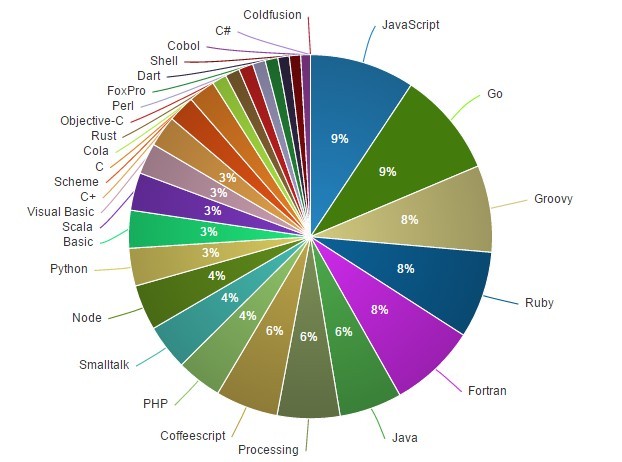
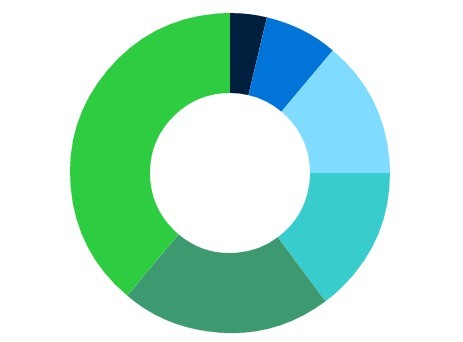
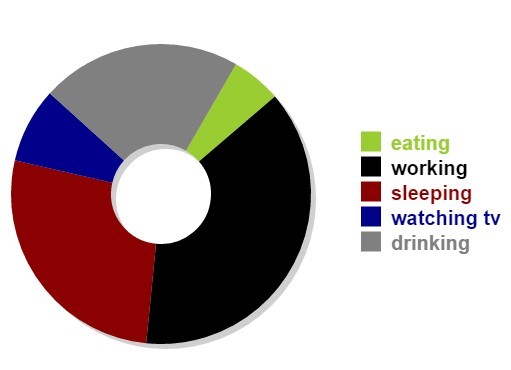
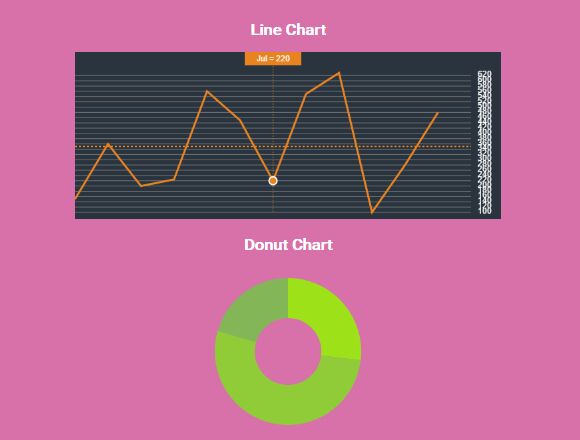
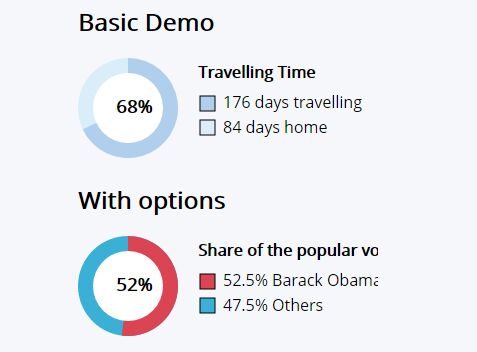
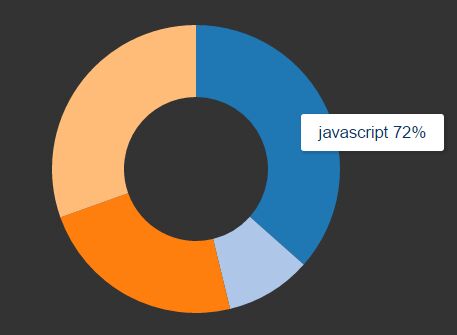
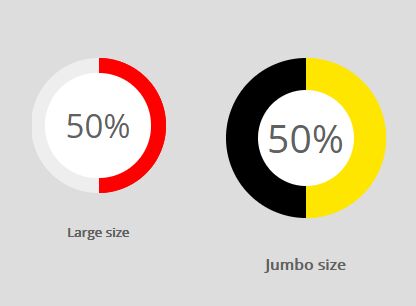
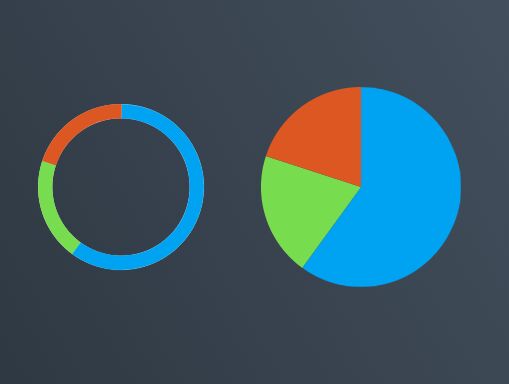
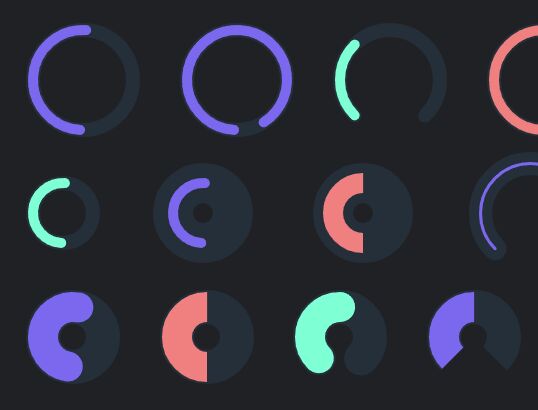
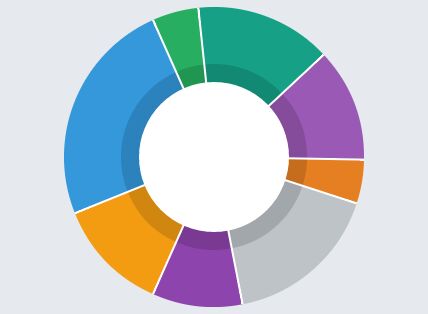
Here are some examples of rendered donuts with default (randomly chosen) chunk colors: