jquery-donut
Canvas-based donut charts. Kind of.
Usage
With a html structure like the following:
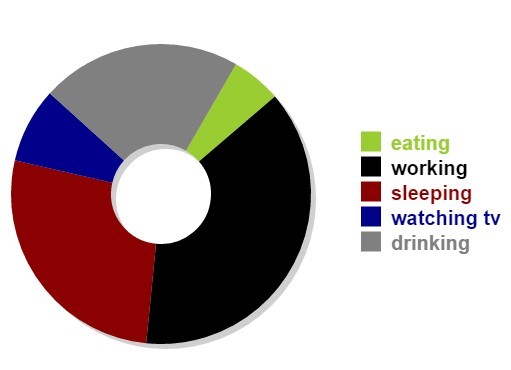
<canvas id="donut" data-title="Chart title" width="300" height="200"> <div data-value="4">Legend for item #1</div> <div data-value="8">Legend for item #2</div> <div data-value="15">Legend for item #3</div> <div data-value="16">Legend for item #4</div> <div data-value="23">Legend for item #5</div> <div data-value="42">Legend for item #6</div> </canvas> ~~~html You create a donut chart like this: ~~~js $('#donut').donut(options);The title of the chart will be rendered inside the hole. Currently the item labels or values are not shown anywhere.
Options
options is an object with the following optional properties:
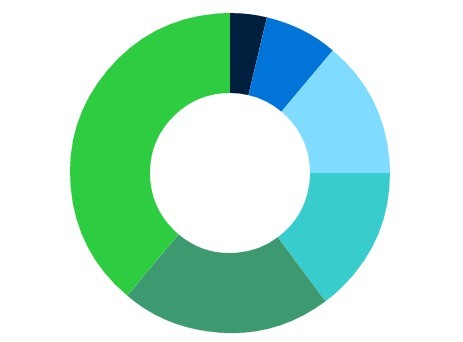
colors: An array of CSS colors for the slices of the chart. The defaults are taken from http://clrs.cc/.