Pista.js
Lightweight time chart library for jquery/zepto.js.
The goal is to have a 5-6kb library, easy to download also on mobile and that works well both with jquery and zepto. I need it for a new version of trackthisfor.me.
Therea are a lot of stuff that are missing (like the legend, and a non-time xaxis), but i don't want to add a lot of bloat. If you want to have a really customized library, use flot.
The usage is really easy (and borrowed from flot for some things).
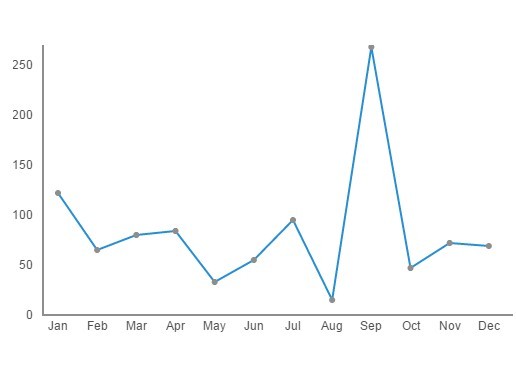
Basic usage
Create a div that will be the container of the chart:
<div id="chart"></div>Then you only need to run this js code:
$(function(){ $("#chart").pista(data, options, tooltipCallback); })The 'data' is an array of data series in this format:
[ { name:"first", data:[ {value:25, date:"12/14/2014"}, {value:32, date:"12/15/2014"}, {value:45, date:"12/17/2014"}] }, { name:"second", data:[ {value:23, date:"12/13/2014"}, {value:26.6, date:"12/18/2014"}] } ]the 'options' is an object with all the options. These are the default options:
pista.defaults = { height: 100, width: 100, x:{margin:15, min: null, max:null}, y:{margin:0.2, min:null, max:null}, goal: {show:false, value:23, color: mainColor}, tooltip: {show:true, maxRadius: 3}, lines: {show: true, fill: false, curve:false, strokeColor: [mainColor, secondaryColor], strokeWidth: 4, fillOpacity: 0.7, fillColor:[mainColor, secondaryColor]}, points:{show: true, strokeWidth:3.5, strokeColor:[mainColor, secondaryColor]}, labels:{ lineWidth: 0.3, fontSize: 11, x:{number: 7, show:true, color:"#858585", grid:false }, y:{number:4, show:true, color:"#858585", grid:true}} }; - y.margin is a float number.
- x.min, x.max are in the MM/dd/yyyy format.
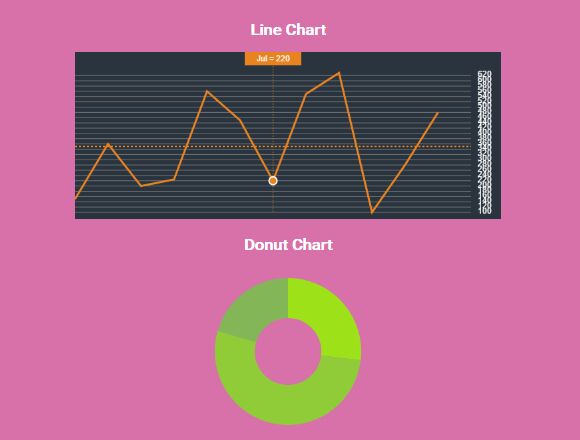
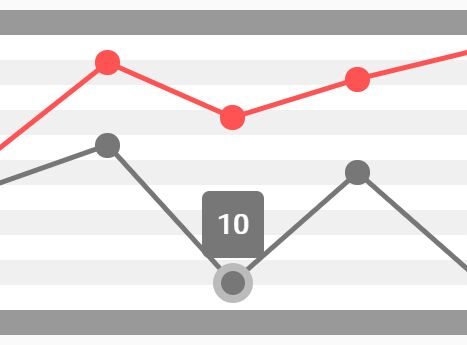
- the goal is a simple horizontal line that will be drawn on the goal.value
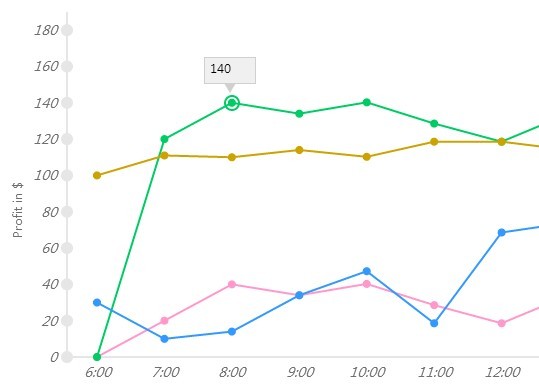
- tooltip.maxRadius is the max distance of the mouse from the point to call the tooltipCallback.
- every **Color object (strokeColor, fillColor...) is an array whose length is the number of data series.
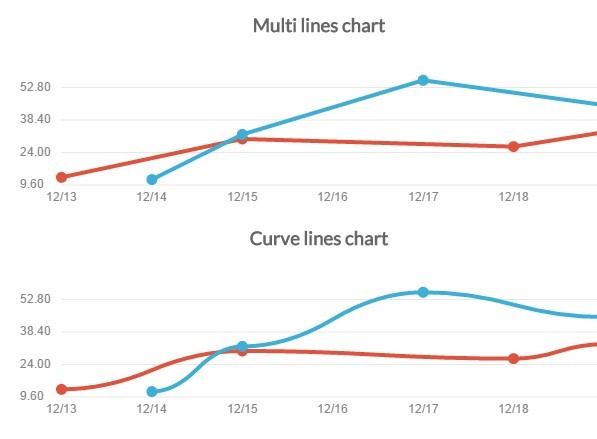
- lines.curve draws the lines in a smoother way with the canvas quadraticCurveTo function.
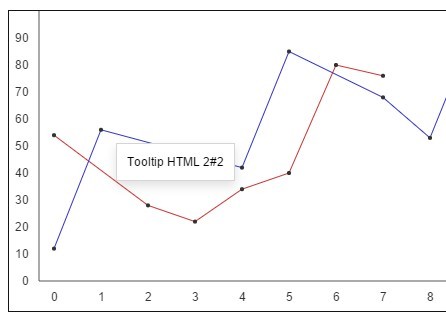
the 'tooltipCallback' is a callback called everytime the mouse moves over the chart. An example of tooltipCallback can be this:
function(tooltip){ if(tooltip.found){ tool=$("<div id='tooltip'>"); tool.appendTo("body"); tool.html(tooltip.point.value); tool.css({top:tooltip.mouse.pageY-40, left: tooltip.mouse.pageX}) }else{ $("#tooltip").remove(); } }the t object is composed by:
t = { found: false point: { x: canvas_x, y: canvas_y, date: 'date in millis', value: 'the value of the point'} mouse: { pageX: 'x of the mouse (in the document)', pageY: 'y of the mouse (in the document)'} }