jqCandlestick
jQuery plugin for creating line, bar and candlestick charts.
Supported browsers
Should work in all browsers that support the canvas element (tested in newest versions of Chrome, Firefox and Internet Explorer).
Support for Internet Explorer 8 and below should be possible using polyfill and an older version of jQuery. See https://code.google.com/p/explorercanvas for polyfill.
Todo
- Support for non-date x-axis
- Update data dynamically
- Fix x-axis
Usage
Include jQuery, jqCandlestick JavaScript and jqCandlestick CSS:
<script type="text/javascript" src="js/jquery.min.js"></script> <script type="text/javascript" src="js/jquery.jqcandlestick.min.js"></script> <link rel="stylesheet" type="text/css" href="css/jqcandlestick.css" /> It is important that you include jQuery before jqCandlestick.
Create a container for your chart and use the jqCandlestick() function on it to create the chart:
<div id="my-chart" style="width: 640px; height: 480px;"></div> <script type="text/javascript"> $(function() { var data = [/* ... */]; $('#my-chart').jqCandlestick({ data: data, }); }); </script> Where data should be a variable containing a multi-dimensional array of data. The expected format of the data-array depends on the number of data series in the chart. The first element of each row is the x-value (as a UNIX timestamp) (this can be changed in the options).
Many configuration options are available. The default options are defined in $.fn.jqCandlestick.defaults.
Data series
Multiple data series can be defined for a chart:
<script type="text/javascript"> $(function() { $('#my-chart').jqCandlestick({ data: data, series: [{ type: 'line', name: 'Series #1', }, { type: 'point', name: 'Series #2', dataOffset: 2 }], }); }); </script> Each series inherits its settings from $.fn.jqCandlestick.defaults.seriesDefaults, which is defined as:
seriesDefaults: { type: 'point', name: null, names: [], dataOffset: 1, yAxis: 0, color: '#fff', } Four built-in types are available (defined in $.fn.jqCandlestick.types): 'point', 'line', 'column' and 'candlestick'. The name-option defines the name of the series (shown when hovering over the chart) while the names-option, which is only used by type 'candlestick', defines the labels for "open", "high", "low" and "close". The dataOffset-option defines at which offset the values for the series start. The default is 1 which means that a default point-chart will expect a data-array of the format:
[ [1391697000000, 23], // timestamp, value (offsets 0 and 1) [1391696100000, 14], [1391695200000, 5], // etc... ] The 'candlestick' type is a bit different, in that it expects 4 values at the offset, e.g. with dataOffset: 1:
[ [1391697000000, 23, 25, 12, 20], // timestamp, open, high, low, close (offsets 0, 1, 2, 3, 4) [1391696100000, 20, 21, 10, 14], [1391695200000, 14, 20, 5, 7], // etc... ] The yAxis-option specifies which y-axis to use (if multiple y-axes are defined, as explained in a later section).
The x-axis
The xaxis-option can be used to customize the format of the x-axis:
xAxis: { name: 'DATE', months: ['Jan', 'Feb', 'Mar', 'Apr', 'May', 'Jun', 'Jul', 'Aug', 'Sep', 'Oct', 'Nov', 'Dec'], dataOffset: 0, // ... labels: { // ... format: 'date', }, } The name-option is used to set the name of the axis while the months-option defines a list of months (for translation-purposes). As with data series, the dataOffset-option specifies the location of x-values in the data array. The default format for the x-axis is 'date', which is currently the only supported value.
Y-axes
Several y-axes can be defined in the yAxis-option, e.g.:
yAxis: [{ height: 3, }, { height: 2, format: { fixed: 2 }, }] The above example will result in two chart-areas within the chart sharing the same x-axis. The height of the first area will be 60% (3/5) of the total height, while the height of the second area will be 40% (2/5) of the total height.
Each y-axis inherits its options from $.fn.jqCandlestick.defaults.yAxisDefaults which contains the following:
yAxisDefaults: { height: 1, // ... labels: { // ... format: null, // possible values: a function(x) or an object {fixed: y) where y is number of decimals }, } The height-option defines the height of the axis as the numerator of the fraction height / total_height where the total height is the sum of all height-options. E.g. in the above example the total height is 3 + 2 = 5.
The format of the labels of the y-axis can be defined using the labels.format-option. The default is null which means that the raw numbers will be printed. It is possible to print the number with a specific number of decimals by setting format: { fixed: n }, where n is the number of decimals. It is also possible to define a custom formatting function such as format: function(x) { return Math.round(x); }.
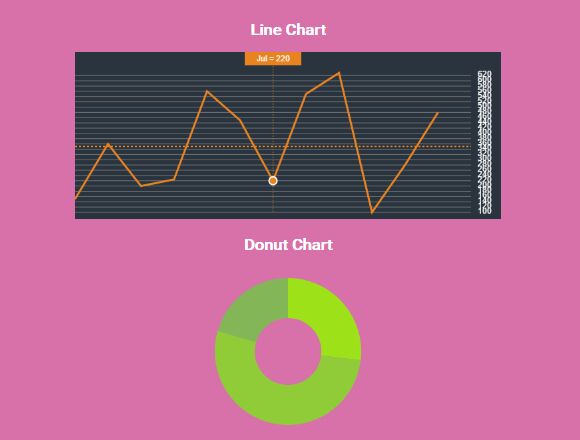
Appearance
There are two built-in themes available: 'light' and 'dark', optimized for white and black backgrounds respectively. The built-in themes are defined in $.fn.jqCandlestick.themes. Colors, fonts and spacings can also be changed manually. The following options are available for customizing the appearance of charts:
{ theme: 'light', // imports default colors from a theme defined in $.fn.jqCandlestick.themes font: '8pt sans-serif', // default font for all text padding: { // distances between the boundaries of the chart-container and the chart itself top: 0, left: 10, bottom: 0, right: 0, }, plot: { spacing: 5, // vertical space between chart areas padding: { // distances between plot area and axes top: 0, left: 15, bottom: 0, right: 15, }, }, xAxis: { color: '#333', // color of x-axis strokeWidth: 1.0, // width x-axis tickSize: 5, // length of each tick (can be negative) labels: { font: null, // font to use for labels color: '#999', // color for labels }, }, yAxisDefaults: { color: '#222', // default color of y-axes strokeWidth: 1.0, // default width of y-axes tickDistance: 40, // minimum distance between ticks labels: { font: null, // font for labels color: '#999', // color for labels }, }, seriesDefaults: { color: '#fff', // default color for series }, info: { color: '#999', // color for info font: null, // font spacing: 20, // distance between values position: 'left', // 'left', 'right' or 'auto' wrap: 'auto', // 'auto', 'yes' or 'no' }, cross: { color: 'rgba(255, 255, 255, 0.5)', // color of cursor-cross strokeWidth: 1.0, // width cursor-cross lines text: { background: '#000', // background color for text font: null, // font for text color: '#999', // color for text }, }, containerClass: 'jqcandlestick-container', // class for chart container chartCanvasAttrs: { // additional attributes to add to chart canvas element class: 'jqcandlestick-canvas', }, crossCanvasAttrs: { // additional attributes to add to cross canvas element class: 'jqcandlestick-canvas', }, } Each series type has additional options available:
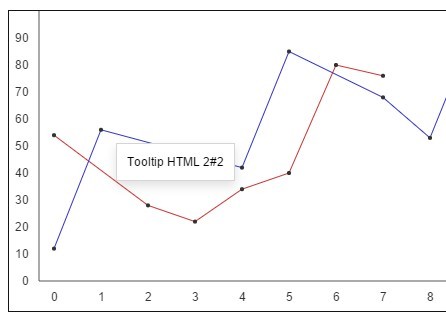
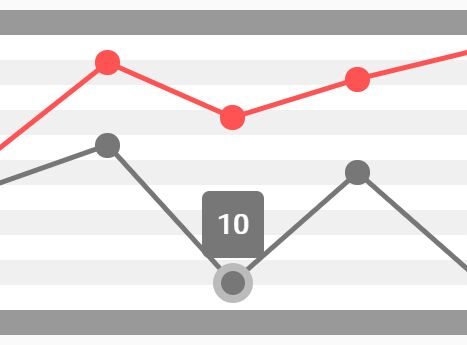
Point charts
Series with type: 'point' has the following additional options:
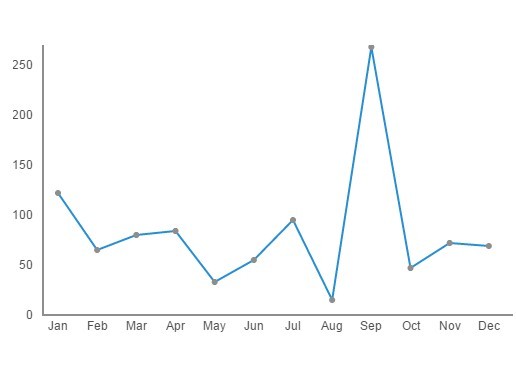
{ radius: 3, // Radius of points stroke: null, // Color of stroke (null for no stroke) strokeWidth: 2.0, // Width of stroke } Line charts
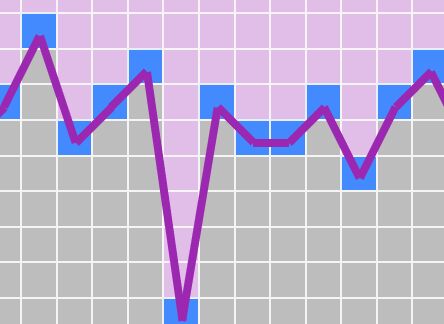
Series with type: 'line' has the following additional options:
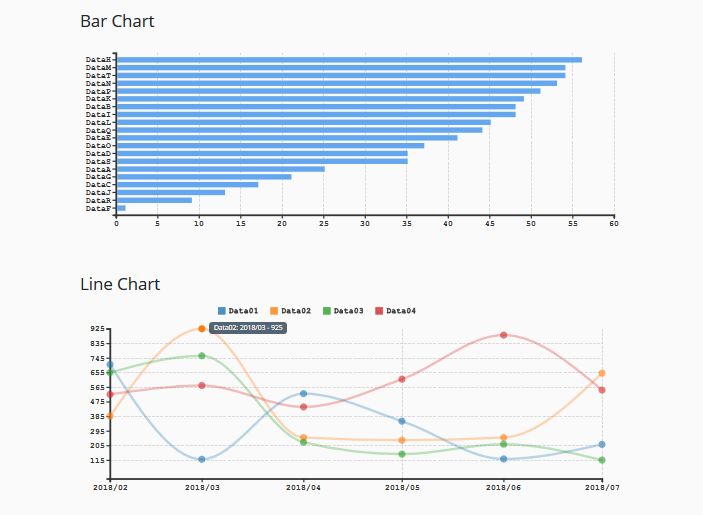
{ strokeWidth: 2.0, // Width of line } Bar/column charts
Series with type: 'column' has the following additional options:
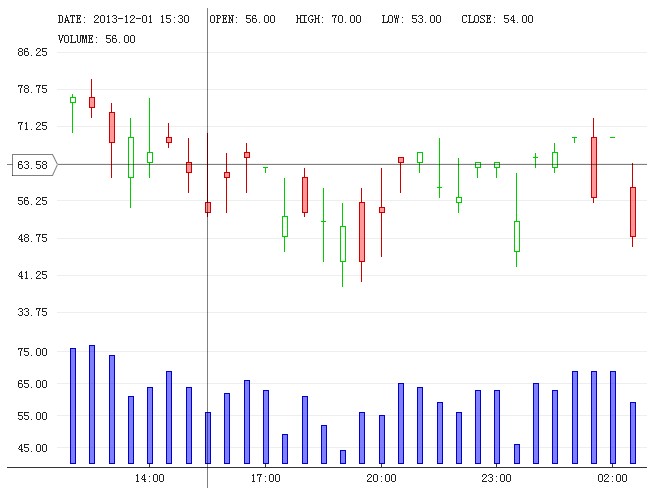
{ width: 5, // Width of each bar/column stroke: null, // Color of stroke (null for no stroke) strokeWidth: 1.0, // Width of stroke } Candlestick charts
Series with type: 'candlestick' has the following addtional options:
{ names: ['OPEN', 'HIGH', 'LOW', 'CLOSE'], // Value names width: 5, // Width of each candlestick downColor: null, // Color of decreasing candlestick downStroke: null, // Stroke color of decreasing candlestick downStrokeWidth: 1.0, // Stroke width of decreasing candlestick upColor: null, // Color of increasing candlestick upStroke: null, // Stroke color of increasing candlestick upStrokeWidth: 1.0, // Stroke width of increasing candlestick } Advanced usage
Currently jqCandlestick only has support for 4 different types of series. You can manually add custom types to the $.fn.jqCandlestick.types-object. As an example, the 'point'-type is defined as:
point: { dataSize: 1, // defines expected number of values in data-array (would be 4 for candlestick) radius: 3, // additional options (default values) stroke: null, // ... strokeWidth: 2.0, // ... // The draw function is called in order to draw a data series of this type. // It takes the following parameters: // ctx - Canvas context for drawing // settings - The entire settings object // plot - An object containing some information about the plot area, such as: // min, max - minimum and maximum values for plot area // minY, maxY - top and bottom of plot area // series - series settings // data - entire data array // getX - a function, getX(value), that returns the x-value in pixels for a given value // getY - a function, getY(plot, value), that returns the y-value in pxiels for a given plot area and value draw: function(ctx, settings, plot, series, data, getX, getY) { ctx.fillStyle = series.color; ctx.lineWidth = series.strokeWidth; // Iterate over each row in the dataset data.forEach(function(row) { // Find x- and y-values using the provided functions var x = getX(row[settings.xAxis.dataOffset]); // x-axis data offset from settings var y = getY(plot, row[series.dataOffset]); // series data offset from settings ctx.beginPath(); // Draw circle ctx.arc(x, y, series.radius, 0, Math.PI * 2, true); ctx.fill(); // Draw stroke if set if (series.stroke) { ctx.strokeStyle = series.stroke; ctx.lineWidth = series.strokeWidth; ctx.stroke(); } }); }, },