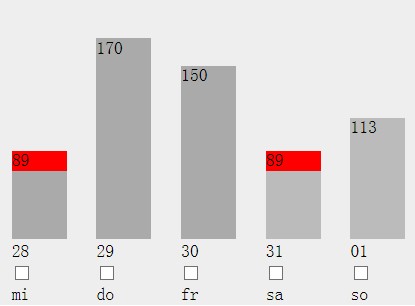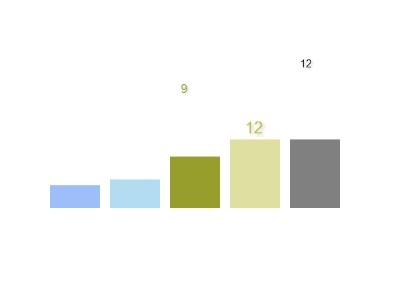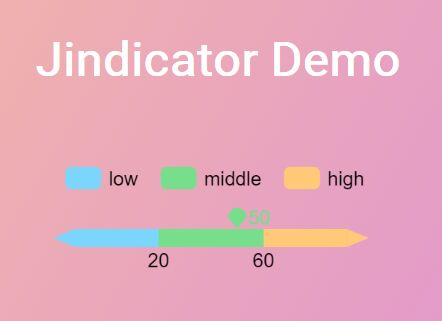
Jindicator
Getting Started
In your web page:
<script src="jquery.js"></script> <script src="dist/JIndicator.min.js"></script> <script> $('#demo').JIndicator({ barValues: [, 20, 60,], indicatorValue: 50 }); </script>
Examples
<html lang="zh-CN"> <head> <meta charset="utf-8" /> <meta http-equiv="X-UA-Compatible" content="IE=edge" /> <meta name="viewport" content="width=device-width, initial-scale=1" /> <script src="jquery.js"></script> <script src="dist/JIndicator.min.js"></script> </head> <body> <div id="demoCanvas"></div> <p>sadsadas</p> </body> <script type="text/javascript"> $('#demoCanvas').JIndicator({ //barColor: { // left: '#123456', // middle: '#e34222', // right: '#a9a233' //}, barValues: [, 20, 60,] }); $('#demoCanvas').JIndicator({'indicatorValue': 120}); </script> </html>Release History
(Nothing yet)