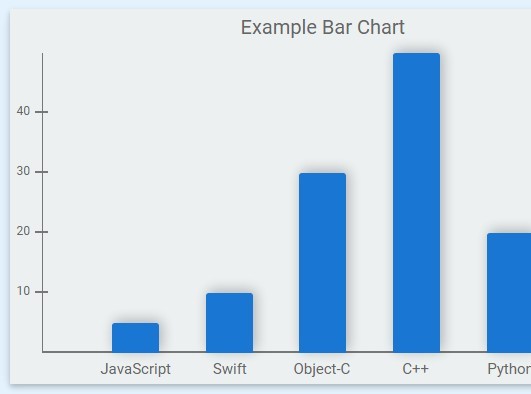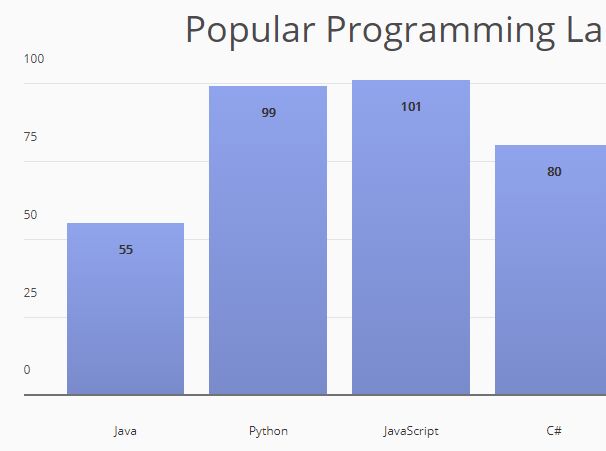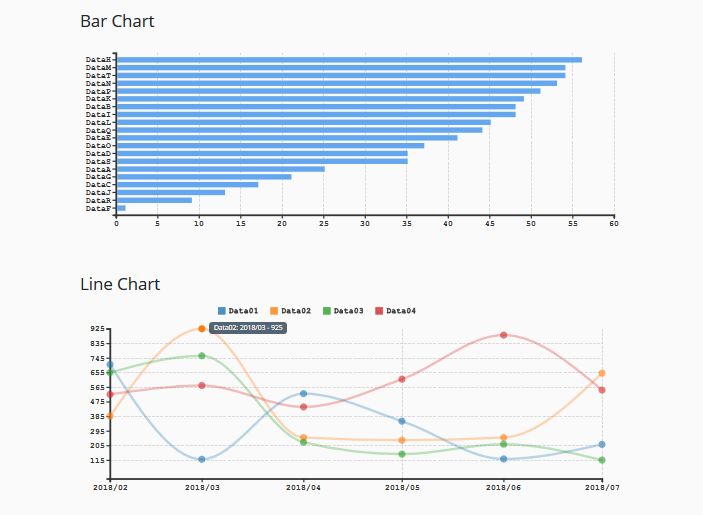
Animated bar chart - jQuery plugin


jQuery plugin for rendering animated bar charts using jQuery and D3.js library.
Table of Contents
About
 My goal is to keep this plugin light and simple to use. I'm not planning to implement all of D3.js library features into it. There is a source in src folder, so feel free to experiment with code. You can find some examples with different settings in examples folder. For the complete list of options see Documentation section.
Download and install
You need to include D3.js, jQuery and bar chart libraries. For D3 and jQuery, visit their web sites or include scripts in your head tag. Copy dist folder to your project and include:
<link rel="stylesheet" href="./dist/bar.chart.min.css" /> <script src='https://code.jquery.com/jquery-3.3.1.min.js'></script> <script src='https://d3js.org/d3.v4.min.js'></script> <script src="./dist/jquery.bar.chart.min.js"></script>Quick start
Add div container to your body tag:
<div id="chtAnimatedBarChart" class="bcBar"></div>You need to prepare data for the chart:
var chart_data = [ { "group_name": "Google", "name": "Jan", "value": 26037 }, { "group_name": "Google", "name": "Feb", "value": 8597 }, { "group_name": "Apple", "name": "Jan", "value": 33102 }, { "group_name": "Apple", "name": "Feb", "value": 43426 }, ... ]Then you need to initialize the chart:
$('#chtAnimatedBarChart').animatedBarChart({ data: chart_data });Documentation
There is a few options that can be used to customize the look of the chart. Configuration of the chart can be done by passing the options you want to define into the animatedBarChart constructor as an object. For example:
$('#chtAnimatedBarChart').animatedBarChart({ data: chart_data, chart_height: 200, show_legend: false, ... });List of available options
option: data - type: array of objects
Default [].
Data that will be used for chart rendering. You need to have 3 properties in every object of data array:
- group_name - this property is used for data grouping and for the legend,
- name - this property is used for x axis,
- value - this property is used for y axis.

Example:
{ "group_name": "Google", "name": "Jan", "value": 26037 }, { "group_name": "Google", "name": "Feb", "value": 8597 }, ...option: params - type: object
Properties:
- group_name - default: 'group_name', type: string,
- name - default: 'name', type: string,
- value: default: 'value', type: string.
You can customize which properties from your data will be rendered.
Usage: if your data is in format:
{ "company": "Google", "month": "Jan", "employees_no": 26037 }, { "company": "Google", "month": "Feb", "employees_no": 8597 }, ...You can set default options to:
$('#chtAnimatedBarChart').animatedBarChart({ data: chart_data, params: { group_name: 'company', name: 'month', value: 'employees_no' } });option: chart_height - type: number
Default value is 400. Height of the chart in pixels.
Usage:
$('#chtAnimatedBarChart').animatedBarChart({ data: chart_data, chart_height: 200 });option: colors - type: array
Default value is null. There is already 10 predefined colors that will be used for different groups. You can override this setting by defining your own colors.
Usage:
$('#chtAnimatedBarChart').animatedBarChart({ data: chart_data, colors: ['red', 'blue', 'lime', ...] or ['#f44242', '#0048ff', '#04ff00', ...] });option: show_legend - type: boolean
Default value is true. Chart legend will be automatically generated below chart with your group_name values. You can hide legend by sending false through show legend option.

Usage:
$('#chtAnimatedBarChart').animatedBarChart({ data: chart_data, show_legend: false });option: legend - type: object
Default legend settings. Properties:
- position - default: LegendPosition.bottom, type: enum - default legend position (LegendPosition.top, LegendPosition.bottom, LegendPosition.left, LegendPosition.right),
- width - default: 200, type: number - default legend width in pixels for left or right legend position.

Usage:
$('#chtAnimatedBarChart').animatedBarChart({ data: chart_data, legend: { position: LegendPosition.right, width: 150 } });option: x_grid_lines - type: boolean
Default value is true. Display horizontal grid lines. You can hide horizontal grid lines by sending false through this option.
Usage:
$('#chtAnimatedBarChart').animatedBarChart({ data: chart_data, x_grid_lines: false });option: y_grid_lines - type: boolean
Default value is true. Display vertical grid lines. You can hide vertical grid lines by sending false through this option.
Usage:
$('#chtAnimatedBarChart').animatedBarChart({ data: chart_data, y_grid_lines: false });option: tweenDuration - type: int
Default value is 300. Speed of bar animation in milliseconds.
Usage:
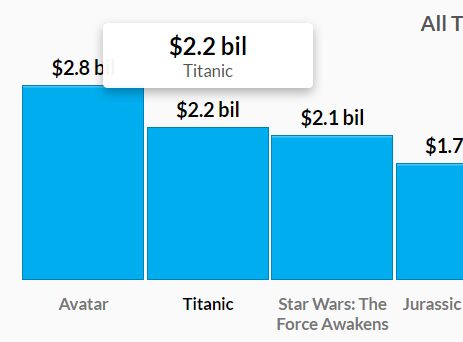
$('#chtAnimatedBarChart').animatedBarChart({ data: chart_data, tweenDuration: 1000 });option: bars - type: object
Default bar settings. Properties:
- padding - default: 0.075, type: number - default bar group padding,
- opacity - default: 0.7, type: number - default bar opacity,
- opacity_hover: default: 0.45, type: number - default bar opacity on mouse hover,
- disable_hover: default: false, type: boolean - disable details on mouse hover,
- hover_name_text: default: 'name', type: string - text for x axis value in details,
- hover_value_text: default: 'value', type: string- text for y axis value in details.

Usage:
$('#chtAnimatedBarChart').animatedBarChart({ data: chart_data, bars: { padding: 0.1, opacity: 0.5, opacity_hover: 0.1, disable_hover: true, hover_name_text: 'month', hover_value_text: 'employees no' } });option: number_format - type: object
Default format for numbers. Properties:
- format - default: ',.2f', type: string - default chart number format,
- decimal - default: '.', type: number - default symbol for the decimal separator,
- thousands: default: ',', type: number - default symbol for the thousands separator,
- grouping: default: [3], type: object - default character grouping,
- currency: default: ['$'], type: object - default currency symbol.
For more about formats, see D3.js documentation.
Usage:
$('#chtAnimatedBarChart').animatedBarChart({ data: chart_data, number_format: { format: ',.4f', decimal: ',', thousands: '.', grouping: [2], currency: ['€'] } });option: margin - type: object
Default chart margins. Properties:
- top - default: 0, type: number - default chart top margin,
- right - default: 35, type: number - default chart right margin,
- bottom: default: 20, type: number - default chart bottom margin,
- left: default: 70, type: number - default chart left margin.
Usage:
$('#chtAnimatedBarChart').animatedBarChart({ data: chart_data, margin: { top: 100, right: 100, bottom: 100, left: 100 } });option: rotate_x_axis_labels - type: object
With this setting, chart will automatically rotate x axis labels when screen resolution is less then minimun_resolution property.
Properties:
- process - default: true, type: boolean - disable automatically labels rotation,
- minimun_resolution - default: 720, type: number - minimum resolution for labels rotation,
- bottom_margin: default: 15, type: number - label bottom margin,
- rotating_angle: default: 90, type: number - label rotating angle,
- x_position: default: 9, type: number - label x position,
- y_position: default: -3, type: number - label y position,

Usage:
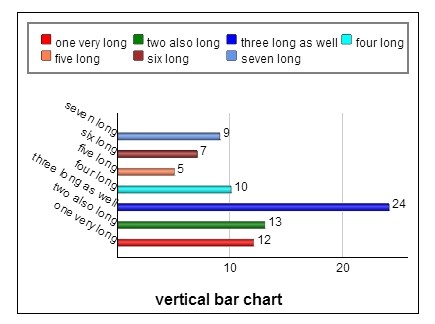
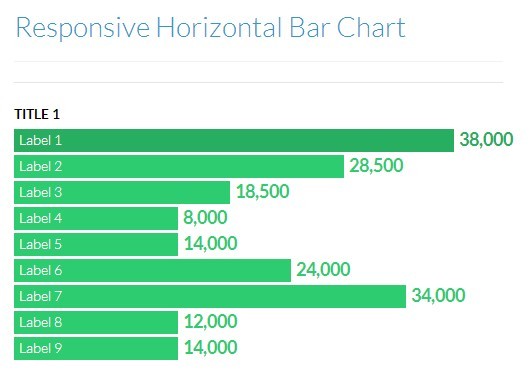
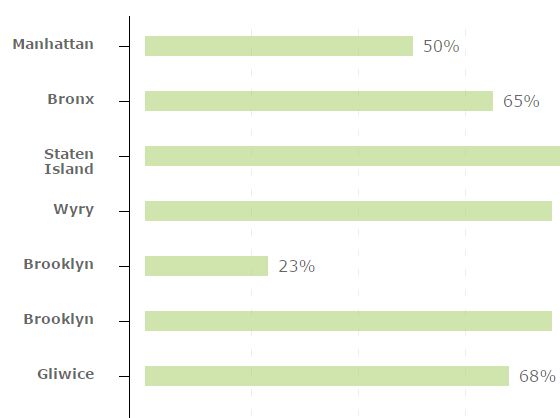
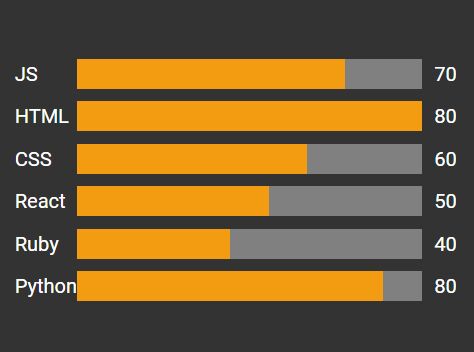
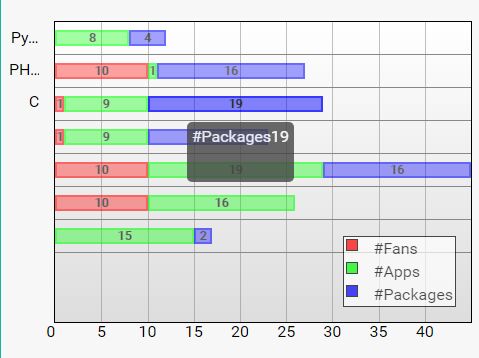
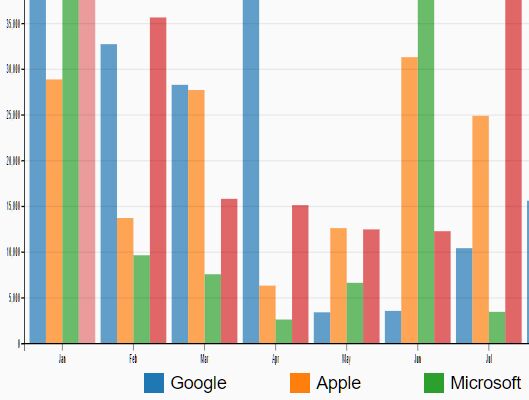
$('#chtAnimatedBarChart').animatedBarChart({ data: chart_data, rotate_x_axis_labels: { process: false, minimun_resolution: 500, bottom_margin: 30, rotating_angle: 45, x_position: 10, y_position: 0 } });option: horizontal_bars - type: boolean
Default value is false. With this setting, you can change default vertical to horizontal orientation.

Usage:
var chart_data = getData(); chart = $('#chtAnimatedBarChart').animatedBarChart({ data: chart_data, horizontal_bars: true });Updating chart
You can update chart data by calling updateChart function. See filter_data_example.html from examples folder.
Usage: First, you need to initialize the chart:
var chart = $('#chtAnimatedBarChart').animatedBarChart({ data: chart_data, ... });Then you need to call updateChart function with new data and options:
chart.updateChart({ data: new_chart_data });Changelog
v1.2
- Set legend position (option: legend: { position: LegendPosition.right, width: 200 }), look at right legend example (examples/right_legend_example.html),
- Added responsive style for the legend,
- Bug Fixes.
v1.1
- Horizontal bar orientation (option: horizontal_bars, default: false), look at horizontal bar example (examples/horizontal_example.html),
- Code optimization,
- Fixed legend overlapping.
To be done
Chart orientation (horizontal/vertical bars),Legend position,- Display values on bars,
- ...