graphite
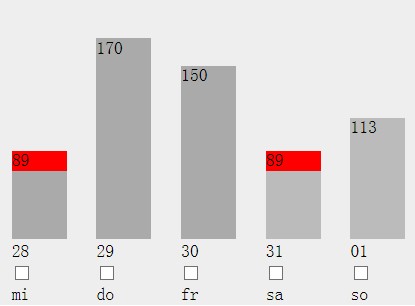
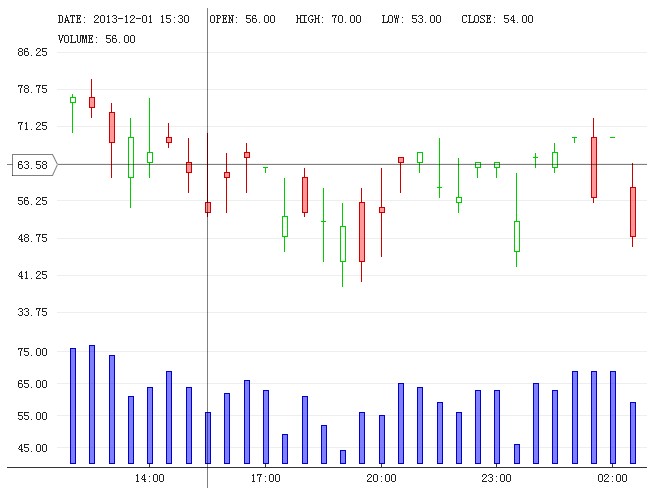
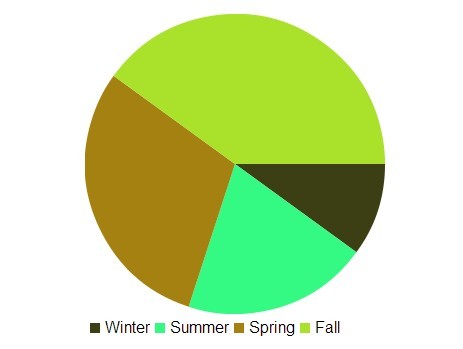
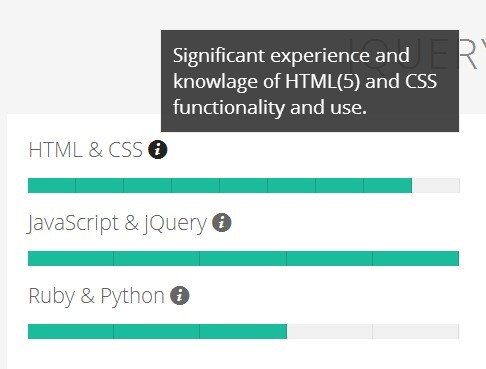
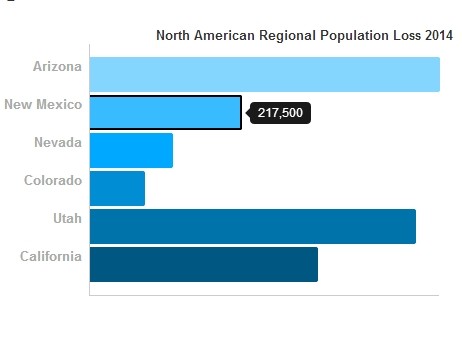
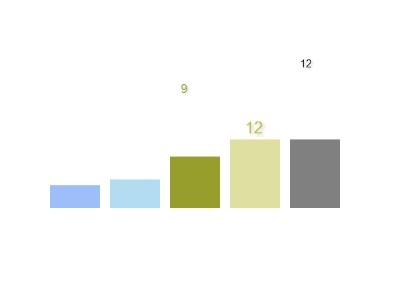
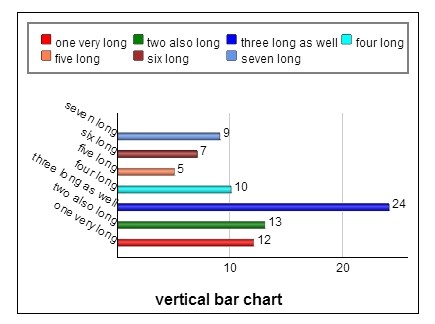
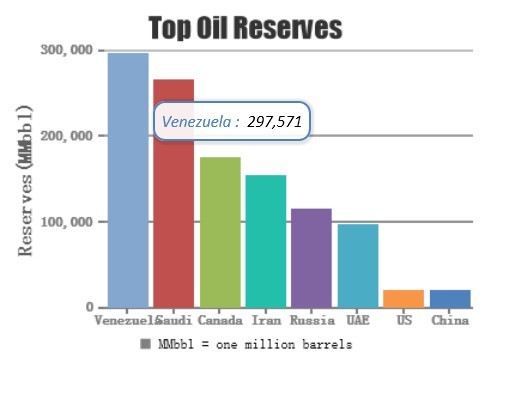
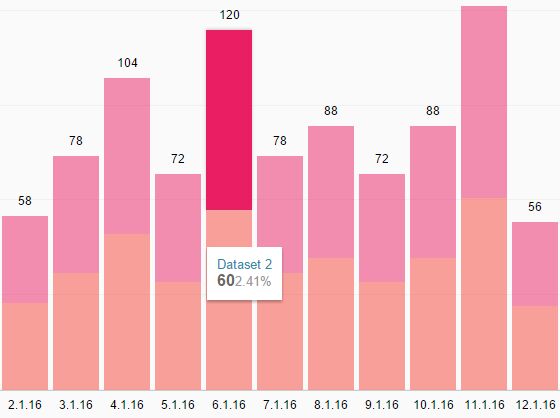
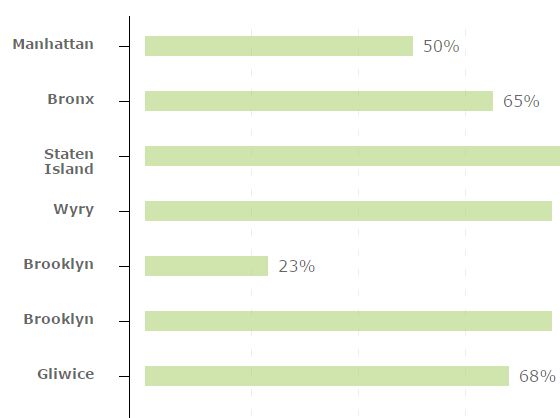
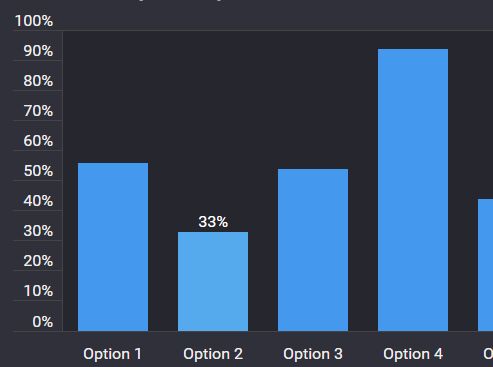
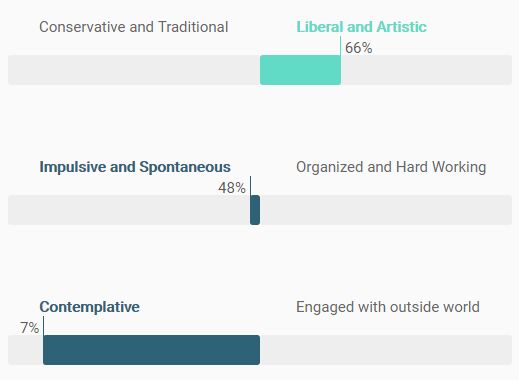
A tiny, minimalist javascript library for generating simple bar graphs.
(Lighthouse Labs 2018 Prep Stretch Project)
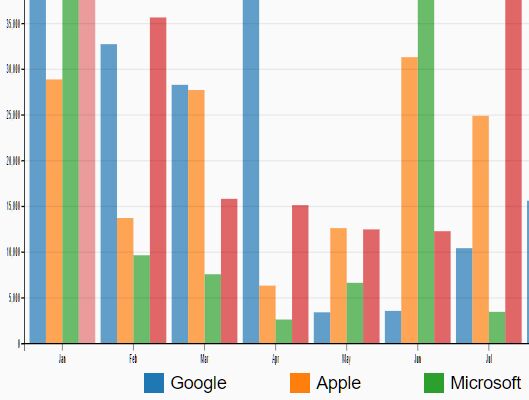
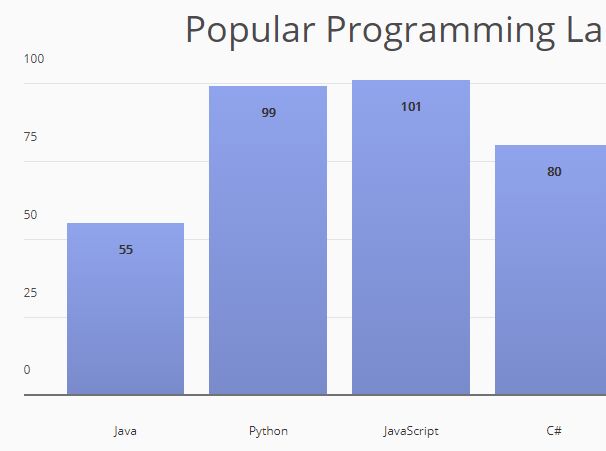
Demo
Getting Started
Simply add graphite.js to your source directory and include it as a script in your index.html file. You'll also need jQuery. In your main .js files, you can now use the graphite function to render a bar graph to an element of your choice.
API
To create a graph, call graphite(data, options, element).
graphite takes 3 parameters: data, options, and element.
data should be passed an object with keys representing x-axis labels and values representing the numerical values of the corresponding bar. For example, {'baseball': 40, 'football': 48, 'soccer': 39}.
options is an optional parameter. Like data, it should be an object. Use 0 for default settings. The available options include:
-
width: The width of the graph container. Note that if you pass in a value that causes the columns to render improperly (as in the case of too many columns for too small of a width), the width will be automatically adjusted to make the bars fit properly. -
height: Sets the height of the graph container. -
fixPadding: Sometimes other CSS rules and frameworks (namely Bootstrap/Foundation) can negatively impact the bottom alignment of columns and separators. This option should be used like so:{'fixPadding': number}if needed. Ex:{'fixPadding': 22} -
title: Adds an h2 title to the top-center of the graph. -
barColor: Changes the bar color. Use a string with a Hex or RGB value. Linear gradients can be used, too. Ex:{'color': '#884dff'}{'color': "linear-gradient(rgb(144, 164, 237), rgb(122, 139, 204))"} -
labelFont: Styles the font of x-axis labels. Takes an array['fontcolor', 'fontsize', fontWeight]. Font color is a string with a Hex/RGB value and font size is a plain number. Font weight is a string (i.e. "400" or "bold"). -
barFont: Styles the font of the bar value numbers. Takes an array['fontColor', 'fontSize', 'fontWeight']. Font color is a string with a Hex/RGB value and font size is a plain number. Font weight is a string. -
titleFont: Same as labelFont and barFont options. Note that since the title is displayed as an h2 element, some styles may be overriden by any CSS affecting header elements.
element: The ID of the element that the graph will be rendered to. Should not be a string.
Example Usage
graphite({'One': 1, 'Two': 2, 'Three': 3, 'Four': 4}, {'height': 400, 'width': 1200, "title": "Simple Graph"}, myDivId)
graphite(dataObject, 0, otherDivId)
graphite({'Baseball': 33, 'Football': 29}, {'barColor': 'rgb(130, 187, 237)'}, bestDivId)
index.html
<body> <div id="example1"></div> </body> main.js
var exampleData = { 'Indian': 55, 'Hispanic': 101, 'Black': 68, 'White': 78, 'Middle-Eastern': 71, 'Asian': 80, 'Native': 26, 'Other': 39 }; var exampleOptions = { 'height': 350, 'title': 'Poll Results', 'width': 1000, 'fixPadding': 18, 'barFont': [0, 12, "bold"] }; graphite(exampleData, exampleOptions, example1); A work in progress
The purpose of this project is primarily to learn and to become familiar with creating reusable code with javascript. As such, there are probably more than a few unexpected kinks to be worked out.
To do:
- Allow stacked bars.
- Allow individual bar colors.
Resources
- jQuery Official Documentation
- Eloquent Javascript
- w3schools CSS Tutorial
- Bootstrap boilerplate from https://bootswatch.com