gvChart
Note: This code is no longer maintained and most likely, you do not want to use it. It became quite popular around 2013, but since then most people stopped using jQuery (or at least the version of jQuery it was created for). So if you really need it: here it is! If you want to maintain - feel free to fork. It's under MIT license.
gvChart is a plugin for jQuery, that uses Google Charts to create interactive visualization by using data from the HTML table tag. It is easy in use and additionally it allows you to create five types of the charts.
Some time ago I tried to find some JavaScript libraries, which would easily create nice charts. I have found two: jQuery Visualise and Google Charts. First one was interesting because of using table HTML tag as a data source for the chart, but it isn’t interactive and there are no labels with values of every chart node. Google Charts provide useful tools for creating interactive charts, but it uses JavaScript Array() as a source of data. So I decided to create my own hybrid of these features.
Steps
Create HTML table
Create table with your data. The table must be well formed:
- Table should have caption element – it will be used as a title of the chart.
- Table should be divided into two parts: thead and tbody.
- In the thead element create one row with th elements. They will be used as arguments presented on the x-axis.
- In the tbody element place data rows. Each row represents one data set. The first element of the row should be th with the name of the data set.
Include gvChart
Include the latest version of jQuery library and gvChart.js script in the document.
<script type="text/javascript" src="http://www.google.com/jsapi"></script> <script type="text/javascript" src="jquery.min.js"></script> <script type="text/javascript" src="jquery.gvChart-0.1.min.js"></script> Important! Google jsapi script tag must be placed before gvChart script.
Before using script you have to initialize Google Api, by using gvChartInit() function. This function may not work when placed in the external JavaScript file. It is better idea to place it inline in the head.
Connect gvChart to the table
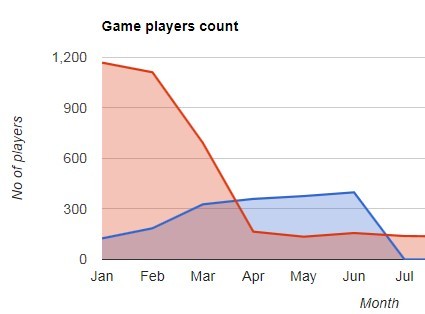
jQuery('#myTable').gvChart({ chartType: 'ColumnChart', gvSettings: { vAxis: {title: 'No of players'}, hAxis: {title: 'Month'}, width: 720, height: 300, } }); gvChart settings
chartType – You can use five different google charts, by setting chartType to one of:
- AreaChart
- LineChart
- BarChart
- ColumnChart
- PieChart
hideTable - Default: true – If set to false, it won’t hide table while creating the chart.
gvSettings – In the gvSettings variable you can place Google Charts settings, which you can find in the Google Visualization API Gallery.
Examples
See examples.html file for some demos.