


vue-highcharts
The component of Vue 2.0 for highcharts
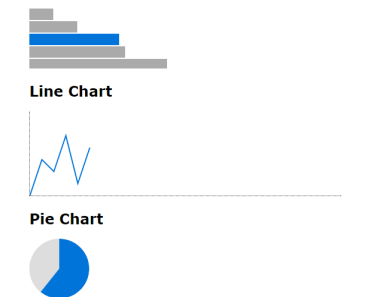
Check the Demo or Demo On CodeSanbox
Installation
npm
make sure you have installed highcharts.js.
npm install vue2-highcharts --save Usage
Using ES6 Module in the component with load async data
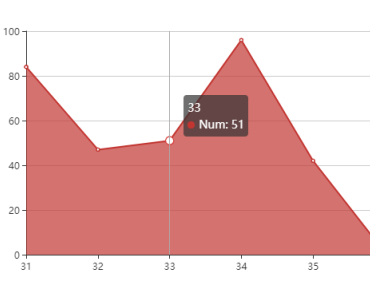
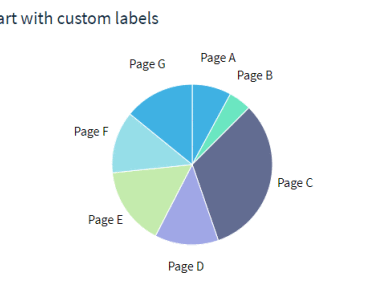
<template> <div> <vue-highcharts :options="options" ref="lineCharts"></vue-highcharts> <button @click="load">load</button> </div> </template> <script> import VueHighcharts from 'vue2-highcharts' const asyncData = { name: 'Tokyo', marker: { symbol: 'square' }, data: [7.0, 6.9, 9.5, 14.5, 18.2, 21.5, 25.2, { y: 26.5, marker: { symbol: 'url(http://www.highcharts.com/demo/gfx/sun.png)' } }, 23.3, 18.3, 13.9, 9.6] } export default{ components: { VueHighcharts }, data(){ return{ options: { chart: { type: 'spline' }, title: { text: 'Monthly Average Temperature' }, subtitle: { text: 'Source: WorldClimate.com' }, xAxis: { categories: ['Jan', 'Feb', 'Mar', 'Apr', 'May', 'Jun', 'Jul', 'Aug', 'Sep', 'Oct', 'Nov', 'Dec'] }, yAxis: { title: { text: 'Temperature' }, labels: { formatter: function () { return this.value + '°'; } } }, tooltip: { crosshairs: true, shared: true }, credits: { enabled: false }, plotOptions: { spline: { marker: { radius: 4, lineColor: '#666666', lineWidth: 1 } } }, series: [] } } }, methods: { load(){ let lineCharts = this.$refs.lineCharts; lineCharts.delegateMethod('showLoading', 'Loading...'); setTimeout(() => { lineCharts.addSeries(asyncData); lineCharts.hideLoading(); }, 2000) } } } </script>you can get the chart instance by this.$refs.lineCharts
And using the methods of Highchart with delegateMethod()
If you want to use Highstock, Highmaps or any other add-ons, you should load add-ons as a module.
Load Drilldown module
import Exporting from 'highcharts/modules/Exporting.js' import Drilldown from 'highcharts/modules/Drilldown.js' import Highcharts from 'highcharts' // Load Drilldown module Drilldown(Highcharts); // Load Exporting module Exporting(Highcharts); <vue-highcharts :highcharts="Highcharts" :options="drilldownOptions" ref="drilldownChart"></vue-highcharts>you can ses Highcharts docs - Install from npm
Using with Nuxt.js
In Nuxt.js use vue2-highcharts, you should define a globle Component vue-highcharts.js for in ~/plugins:
import Vue from 'vue' import VueHighcharts from 'vue2-highcharts' Vue.component('VueHighcharts', VueHighcharts)and add it in nuxt.config.js:
plugins: [{ src: '~plugins/vue-highcharts.js', ssr: false }], after that, you can use vue2-highcharts component in your nuxt.js project.
for more detail, you can see: vue-nuxt-demo for vue-highcharts
Props
| Name | Type | Description(Default Value) |
|---|---|---|
| classname | string | classname for component(default: vue-highcharts) |
| style | object | component styles(default: {}) |
| options | object(require) | options of highcharts |
| highcharts | object | Highcharts instance |
Build Setup
# install dependencies npm install # open "localhost:8080" in browers npm run dev # build for production with minification npm run buildFor detailed explanation on how things work, consult the docs for vue-loader.
License
Copyright (c) 2017-present, superman66