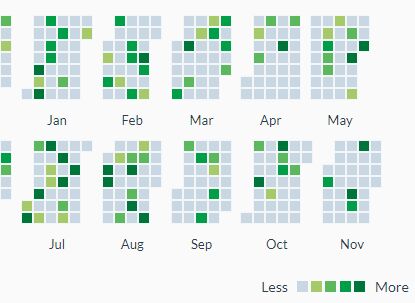
glanceyear
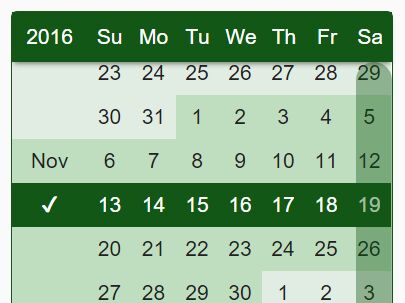
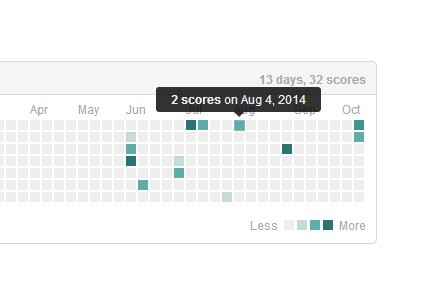
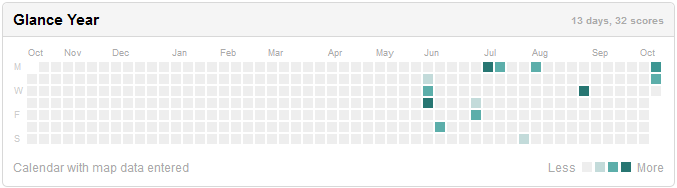
JQuery data visualization / Glance Year
Need JQuery
Version 0.4.1 (2014.03.27)
- Added version tag in script file.
Version 0.4 (2014.11.26)
- New parameter "today";
- Fix bug with first month.
Version 0.3
- Every instance fill your own data;
- New parameter "showToday";
- Fix bug with 54 weeks;
- Added minified script.
Version 0.2
- rebuild mouseover and mouseleave event and now work faster;
- new event 'eventClick'.
How to Use
var massive = [ {date: '2014-8-3', value:'1'}, {date: '2014-8-4', value:'2'}, {date: '2014-9-3', value:'3'}, {date: '2014-10-14', value:'2'}, {date: '2014-10-13', value:'8'}, {date: '2014-7-3', value:'1'}, {date: '2014-7-4', value:'2'}, {date: '2014-7-7', value:'3'}, {date: '2014-7-14', value:'2'}, {date: '2014-6-3', value:'1'}, {date: '2014-6-4', value:'2'}, {date: '2014-6-5', value:'3'}, {date: '2014-6-14', value:'2'} ];Simple initialization plugin
$('div#js-glanceyear').glanceyear(massive);Initialization the plugin with additional parameters
$('div#js-glanceyear').glanceyear(massive, { eventClick: function(e) { $('#debug').html('Date: '+ e.date + ', Count: ' + e.count); }, months: ["Jan","Feb","Mar","Apr","May","Jun","Jul","Aug","Sep","Oct","Nov","Dec"], weeks: ['M','T','W','T','F','S', 'S'], showToday: false, today: new Date() });- eventClick - Event, after click on day [Function];
- month - name of month [Array with string];
- weeks - name of weeks [Array with string];
- showToday - display present day or not [Boolean];
- today - change current date [Date].