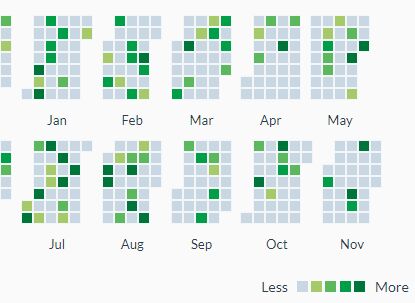
Calendar Heat Map
This jQuery plugin allows to conveniently display data like contributions on a day by day basis, indicating the count by colors.

Install
Using NPM
npm install jquery-calendar-heatmapUsing bower
bower install jquery-calendar-heatmapManual
- Download the latest release from here.
- Copy the
jquery.CalendarHeatmap.jsand thejquery.CalendarHeatmap.cssinto your project. Of cause you can use the minified versions, indicated by.min.jsand.min.cssas well.
Usage
-
Include jQuery and Moment.js into the header of your html file:
<script src="https://cdnjs.cloudflare.com/ajax/libs/jquery/2.1.4/jquery.min.js"></script> <script src="https://cdnjs.cloudflare.com/ajax/libs/moment.js/2.24.0/moment.min.js"></script>
-
Include the plugin after jQuery and Moment.js:
<script src="dist/jquery.CalendarHeatmap.min.js"></script>
-
When the DOM is ready call the plugin:
$("#element").CalendarHeatmap( data, options );
Data
The provided date needs to be a valid date format that can be interpreted by Moment.js. The date needs to provide at least year month and day, e.g. YYYY-MM-DD.
// Provide dates as an array of objects. // Provide the keys `count` and date. Make sure, each date provided is unique for that day. var data = [{count: 2, date: "2017-09-23"}, ...] // Provide dates as an array. // The dates can have any format as long as year month and day are provided. var data = [ "2017-09-23", ...] // Provide dates as an object. // The key is the date, the value is event count. Make sure the date has this format: `YYYY-MM-DD` var data = { "2017-09-23": 2, ...}Options
The Calendar Heat Map can be modified using the following options:
// Default options for the heatmap { title: null, months: 12, weekStartDay: 1, lastMonth: 1, lastMonth: "current month", lastYear: "current year", labels: { days: false, months: true, custom: { weekDayLabels: null, monthLabels: null } }, legend: { show: true, align: "right", minLabel: "Less", maxLabel: "More" }, tooltips: { show: false, options: {} } }title
You can add a title to the calendar heatmap. If no title is set, or set to null it will get ignored.
months
The number of months to display. If not set, the default number of months to be displayed is 12.
lastMonth
The last month shown in the calendar heatmap. Set the month by setting the value between 1 - 12. If not set, the default is the current month.
lastYear
The year of the last month shown. Use the four letter notation, e.g. 2017. If not set, the default is the current year.
weekStartDay
The first day of the week. Set the day by setting the value between 1 - 7, where 1 is Monday, 2 is Tuesday and so on. If not defined Monday is the start day.
coloring
There is a set of different color gradients available. By default standard is selected.
Available Color Gradients
The following gradients are available based of Matplotlib for Python: blue, earth, electric, green, picknick, red, teal, standard, viridis. If you want to define your own color gradient, use custom and add the classes defining the colors to your css stylesheet as described below.
Custom Gradient
Just add the colors to be used for the 4 steps as in the example. In this case the name set for coloring would be the base class name custom.
.custom-1 { background-color: #a6c96a !important; } .custom-2 { background-color: #5cb85c !important; } .custom-3 { background-color: #009e47 !important; } .custom-4 { background-color: #00753a !important; }labels
The calendar heatmap has two sets of labels. One for week days and one for months. By default only the month labels are shown. The visibility can be set for either by setting them to true or false.
Custom format
Week day and month labels can be formatted using the Moment.js format (e.g. MM for the month number or MMMM for the full month name). Use an array, to provide custom labels. For months the array needs to contain 12 elements, e.g. ["janv", "févr", ..., "déc."] and for the week days 7 elements starting with Sunday, e.g. ["Dim", "Lun", ..., "Sam"].
labels: { days: false, months: true, custom: { weekDayLabels: null, monthLabels: null } }legend
The legend for the calendar heatmap is located below the heatmap and visible by default. The visibility can be set by setting show to true or false. Set the alignment using align. Options are right, center or left. Labels for min and max can be set using minLabel and maxLabel. Use null to hide the labels.
legend: { show: true, align: "right", minLabel: "Less", maxLabel: "More" }tooltips
Tooltips require the Bootstrap library. Regardless of using the library, the tiles with representing data counts have a title element with count and date. This example is using Bootstrap 3.3.7 which is deprecated, but will work with Bootstrap 4.1.3 as well.
<!-- Latest compiled and minified CSS --> <link rel="stylesheet" href="https://cdnjs.cloudflare.com/ajax/libs/twitter-bootstrap/3.3.7/css/bootstrap.min.css"> <!-- Latest compiled and minified JavaScript --> <script src="https://cdnjs.cloudflare.com/ajax/libs/twitter-bootstrap/3.3.7/js/bootstrap.min.js"></script>To enable the tooltips just set show to true. By default it is set to false. All settings for tooltips are available as documented and can be passed on using options.
tooltips: { show: true, options: {} }This plugin is based on the jQuery Boilerplate.